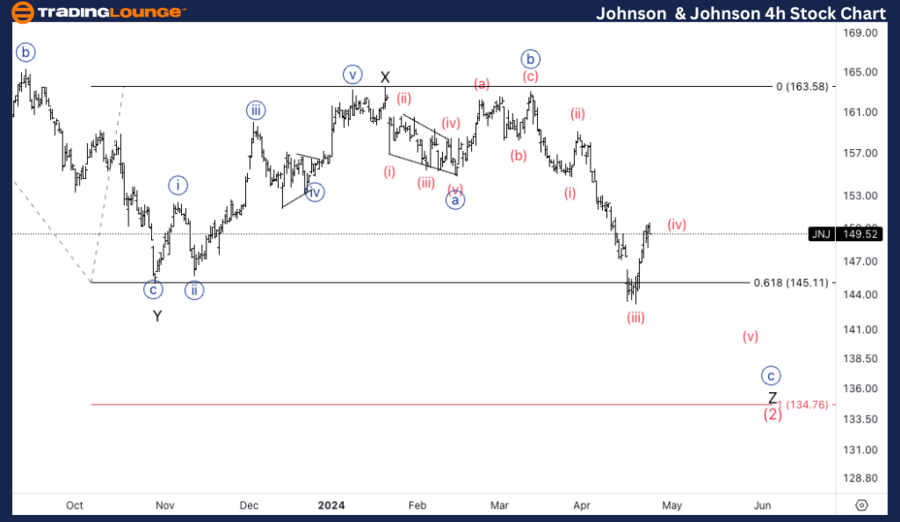
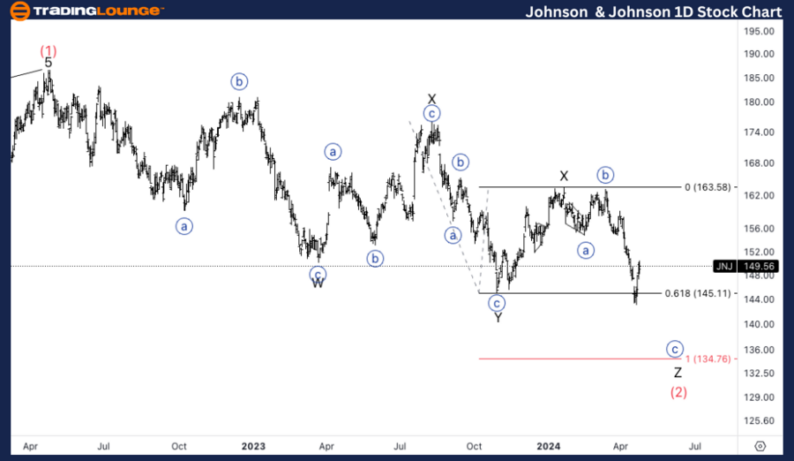
JNJ Elliott Wave Analysis Trading Lounge Daily ChartJohnson & Johnson, (JNJ) Daily ChartJNJ Elliott Wave Technical AnalysisFUNCTION: Counter TrendMODE: CorrectiveSTRUCTURE: ComplexPOSITION: Intermediate (2).DIRECTION: Downside in wave Z. DETAILS: Looking for support as we touched 0.618 Z vs. X. If we find resistance on Medium Level at 150 then we can expected further downside.  JNJ Elliott Wave Analysis Trading Lounge 4Hr Chart,Johnson & Johnson, (JNJ) 4Hr ChartJNJ Elliott Wave Technical AnalysisFUNCTION: TrendMODE: ImpulsiveSTRUCTURE: MotivePOSITION: Wave (iv) of {c}.DIRECTION: Downside into wave (v). DETAILS: Looking to find resistance on 150, as wave (ii) was sharp we could anticipate a sideways wave (iv), to move around 150 itself.On April 24, 2024, we conducted a comprehensive Elliott Wave analysis on Johnson & Johnson (Ticker: JNJ), focusing on the dynamics revealed through the daily and 4-hour chart studies. Our analysis highlights crucial patterns and potential future movements, offering valuable insights for traders and investors engaged in JNJ’s stock.
  * JNJ Elliott Wave Technical Analysis – Daily Chart*Johnson & Johnson is observed in a counter trend phase characterized by a complex corrective structure, specifically placed in Intermediate wave (2). Currently, the stock is progressing through the downside movements of wave Z. Key observations indicate the stock has reached the Fibonacci retracement level of 0.618 Z vs. X, signaling a potential area for finding support. Should resistance solidify at the medium level of $150, further downside could be expected as the pattern completes.* JNJ Elliott Wave Technical Analysis – 4H Chart*The 4-hour chart provides additional granularity into JNJ’s Elliott Wave structure. Unlike the daily chart’s corrective mode, the intraday perspective shows an impulsive mode within a motive structure, pinpointing the stock in wave (iv) of {c}. This suggests that despite the broader correction, short-term dynamics involve impulsive downside movements. With wave (ii) noted as sharp, a contrasting sideways consolidation in wave (iv) is anticipated around $150, leading to a further decline in wave (v).More By This Author:Elliott Wave Technical Analysis: Theta Token Crypto Price News
Elliott Wave Forecast: Identifying Opportunities In Commodity Trading
Elliott Wave Technical Analysis: Analog Devices Inc. – Tuesday, April 23


Leave A Comment