
Past performance does not guarantee future performance, as they say, but Jordan Roy-Byrne, CMT, editor and publisher of The Daily Gold Premium, is persuaded that the bottom in gold is no more than a couple of months away. And after that, look out. In this interview with The Gold Report, Roy-Byrne says that his study of gold’s history explains why gold could retest $1,900 per ounce by the end of 2016 before going parabolic.
The Gold Report: After falling to $1,137 per ounce ($1,137/oz), gold has rallied to $1,200/oz. Has the fabled bottom finally been reached, or will we see one final selloff?
Jordan Roy-Byrne: I do not think we have seen the bottom, but I think we are very close. It should happen within the next couple of months.
TGR: Why do you think we’re so close?
JRB: Typically, markets don’t bottom at random numbers. Gold has really strong support at $1,080/oz, which is the 50% retracement of the entire bull market, and at $1,000/oz, which is the key psychological level and also was a key support level in 2008–2010, so gold is more likely to test those levels than bottom at $1,137/oz.
Two more reasons to believe we haven’t hit bottom are volatility and the Commitment of Traders’ (COT) report. The two biggest volatility spikes in the last six years were at the 2008 bottom and then at the 2011 top. In the last month or so, volatility has picked up after being absent for most of 2014. Gold’s trend is down, so increasing volatility suggests a sharp selloff that could take gold below $1,100/oz. A spike in volatility combined with major support at $1,000/oz is one recipe for a major reversal.
“Balmoral Resources Corp.Balmoral Resources Corp.”
The COT report, which tracks futures traders, suggests that we have not hit an extreme, but again it’s very close. A decline below $1,100/oz or $1,080/oz would likely result in many traders panicking out of the market and at the same time putting on more short positions. Given the current construction of the COT, a decline below $1,100/oz in gold would result in the net speculative position and gross short positions reaching 13-year extremes.
TGR: An alternative explanation for the fall in the gold price is aggressive shorting by institutions such as Goldman Sachs, perhaps aided and abetted by central banks. What do you think of that?
JRB: I don’t think anything of it. Yes, short positions have increased, but this is how futures markets work. It’s just sour grapes.
TGR: Talk about your bear analog for gold and what it tells us.
JRB: I’ll talk about that but also about my analogs for silver and mining stocks. These analogs examine the historic bear markets and plot them on graphs in order to compare them. We must remember that bear markets are a function of price and time. And those with the sharpest declines last the shortest amount of time. The gold and silver crashes in the 1980s lasted less than two years. They were spectacular declines with most of the damage done quickly. But bear markets that last for years are not particularly severe in terms of price.
TGR: What do your analogs tell us about silver and mining stock bear markets?
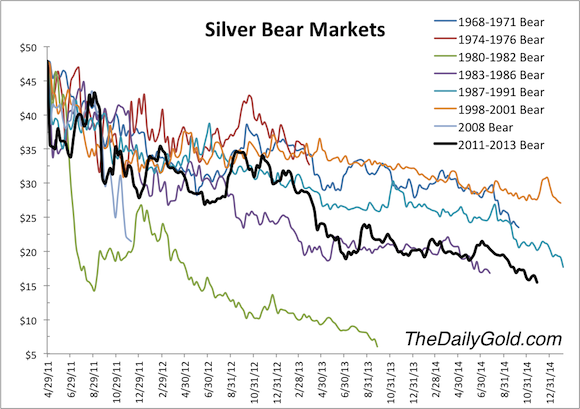
JRB: Most bear markets in mining stocks average about a 65% decline. What we’ve seen in the current bear market is well in line with history. Silver bear market declines are typically 50–70%.
TGR: So the ongoing bear markets in gold, silver and mining stocks are historically typical?
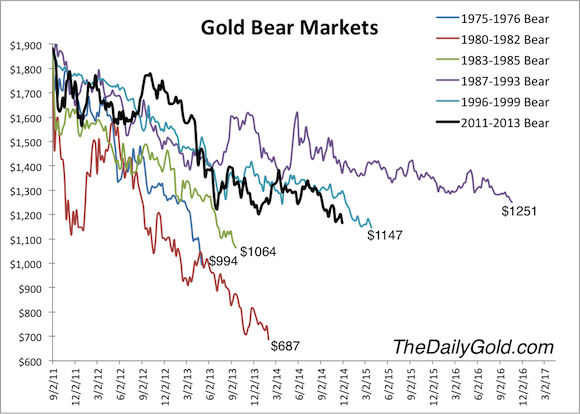
JRB: The current bear markets have lasted a little over 3 years for gold and over 3.5 years for silver and mining stocks. They’ve been fairly severe in terms of time and price but not extreme. Keep in mind that gold went from $250/oz to almost $2,000/oz and silver from less than $4/oz to $50/oz. Those were spectacular moves.


Leave A Comment