Podcast: Play in new window | Play in new window (Duration: 13:17 — 6.1MB) DOW – 51 = 17,776 SPX – 14 = 2053 NAS -64 = 4727 10 YR YLD + .02 = 2.22% OIL + 3.22 = 69.37 GOLD + 44.30 =
December 1, 2014
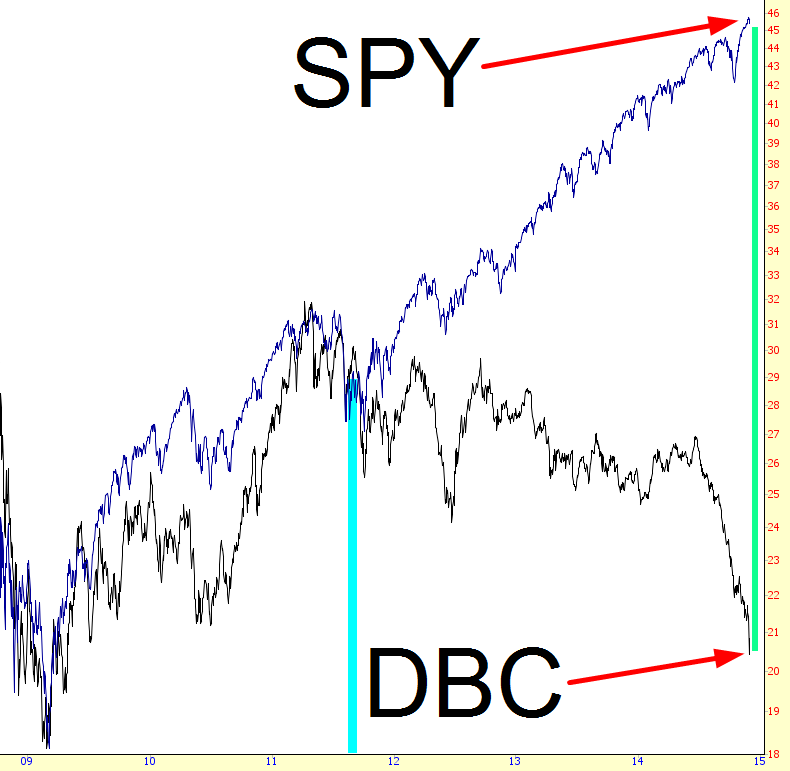
Good evening, Slopers. I was going to bombard you with ETF charts, to assuage my utterly misplaced blogger’s guilt, but I landed on the first one – DBC – and figured it was enough. Allow me to share this with
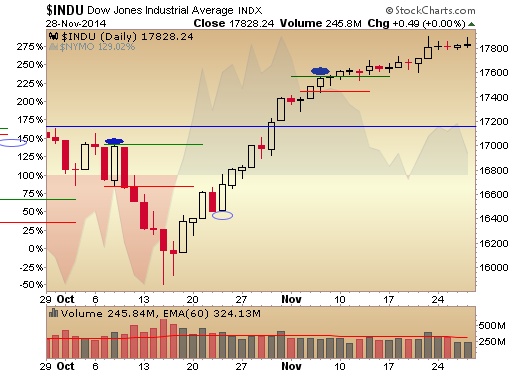
Oct 15th – Nov 6th 17 trading sessions 1705 point gain on Dow 4 down trading sessions with all closing off the lows and near the highs but on one day Nov 7th – Nov 28th 15 trading sessions 274

CHF, We Declare Thee Garbage It is by now well known that after several weeks of intense government propaganda, the Gold Initiative in Switzerland failed rather spectacularly (78% voted against keeping the Keynesian dunderheads running the SNB in check). The
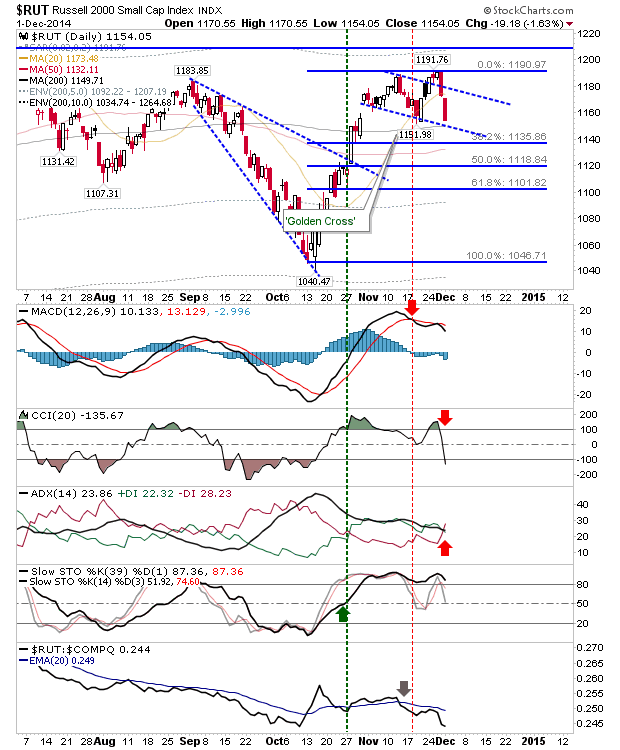
It has been a while, but markets had their first day of distribution in weeks. The selling didn’t clock up big percentage losses, although the Russell 2000 suffered the worst of the selling. There was still a case of post-holiday
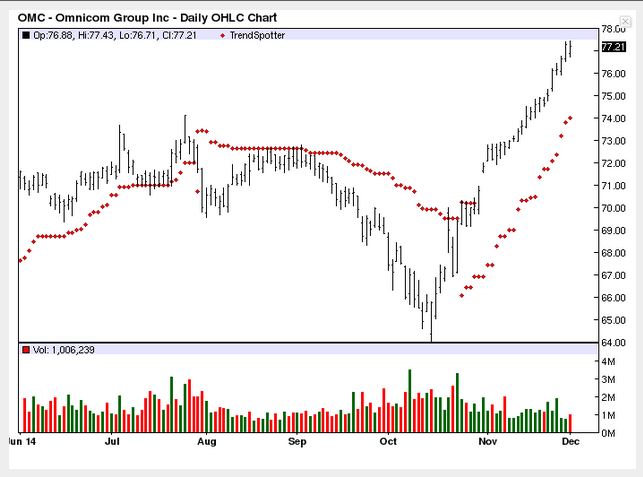
The Chart of the Day belongs to Omnicom Group (NYSE:OMC). I found the stock by sorting the All Time High list for the stocks having the most frequent new highs in the last month then used the Flipchart feature to

As you read this, inflation is eating away at the value of your money. Over time, American’s inflation rate has slowly eroded the value of the dollar to the point where $1 today would only have been worth 4.8 cents
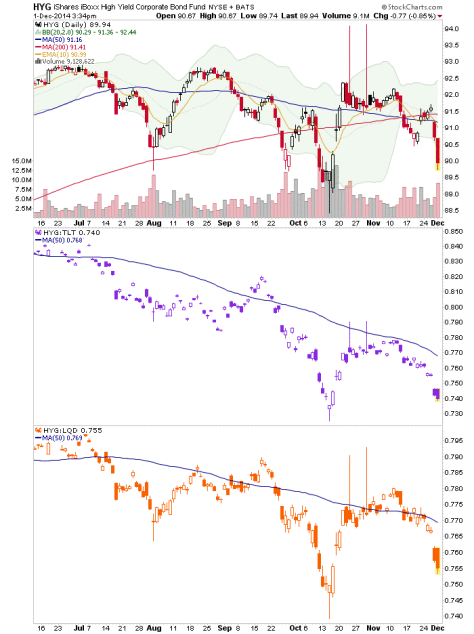
Hey Bueller, junk bonds are doing what? Dropping. Junk bonds vs. quality bonds are doing what? Dropping. Heading into October junk bonds and ratios did what? Anyone? Bueller? Look, I am not trying to come off like a wise guy.
2014 is turning out to be another significant year for the ETF industry. With 175 new ETFs launched this year so far, the total number of products now stands at 1658, while assets under management have increased to $1.99 trillion.
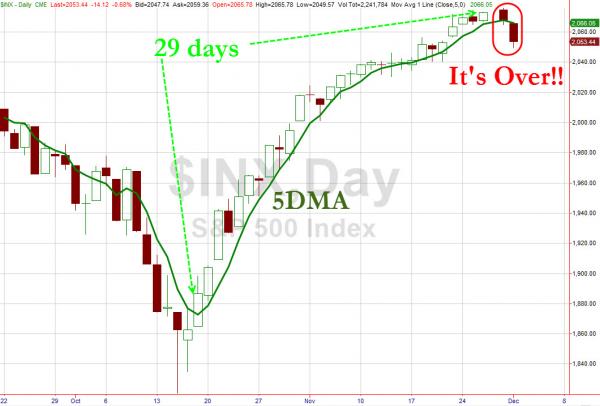
For 29 days – off the Bullard lows – the S&P 500 closed above its 5-day moving average. As MKM’s Jonathan Krinsky noted last week, this is the longest streak of sustained equity momentum higher in the history of US