

from the American Chemistry Council
The Chemical Activity Barometer (CAB) remained unchanged from July, continuing a modest deceleration of growth. The flat reading follows a 0.1 percent increase in July and a flat reading in June.
Compared to a year earlier, the CAB is up 3.2 percent year-over-year, an easing from recent year-over-year gains. All data is measured on a three-month moving average (3MMA).
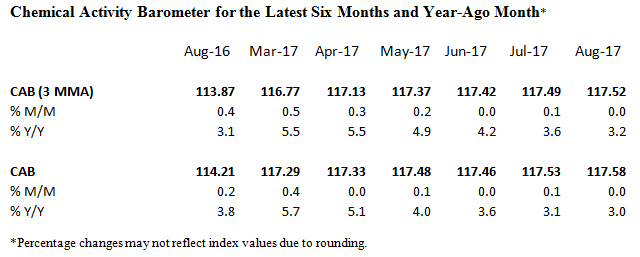
On a year-over-year basis, the unadjusted CAB is up 3.0 percent, also an easing from the previous six months.
The Chemical Activity Barometer has four primary components, each consisting of a variety of indicators: 1) production; 2) equity prices; 3) product prices; and 4) inventories and other indicators.
Three of the four broad categories improved, as did the diffusion index (number of positive contributors relative to total indicators monitored), which rose to 82 percent from 71 percent in July.

z chemical_activity_barometer.png
Caveats on the Chemical Activity Barometer (CAB):
The definition of the CAB:
The Chemical Activity Barometer is a leading economic indicator derived from a composite index of chemical industry activity. The chemical industry has been found to consistently lead the U.S. economy’s business cycle given its early position in the supply chain, and this barometer can be used to determine turning points and likely trends in the wider economy. Month-to-month movements can be volatile so a three-month moving average of the barometer is provided. This provides a more consistent and illustrative picture of national economic trends.
Applying the CAB back to 1912, it has been shown to provide a lead of two to fourteen months, with an average lead of eight months at cycle peaks as determined by the National Bureau of Economic Research. The median lead was also eight months. At business cycle troughs, the CAB leads by one to seven months, with an average lead of four months. The median lead was three months. The CAB is rebased to the average lead (in months) of an average 100 in the base year (the year 2012 was used) of a reference time series. The latter is the Federal Reserve’s Industrial Production Index.


Leave A Comment