This post is a review of all major leading indicators follows – and their trends are generally indicating slower growth.
Philly Fed Leading Index
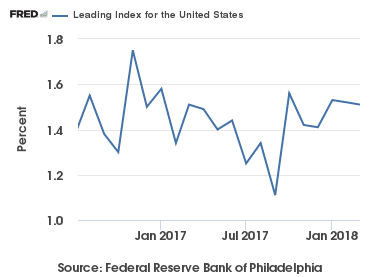
The Philly Fed Leading Index for the United States is continuously recalculated. Note that this index is not accurate in real time as it is subject to backward revision, Per the Philly Fed:
The Federal Reserve Bank of Philadelphia has released the leading indexes for the 50 states for July 2017. The indexes are a six-month forecast of the state coincident indexes (also released by the Bank). Forty-three state coincident indexes are projected to grow over the next six months, and seven are projected to decrease. For comparison purposes, the Philadelphia Fed has also developed a similar leading index for its U.S. coincident index, which is projected to grow 1.2 percent over the next six months.
[click on graphic to enlarge]

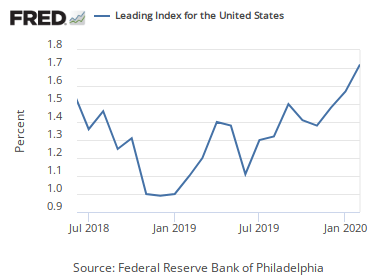
Index Values Over the Last 12 Months
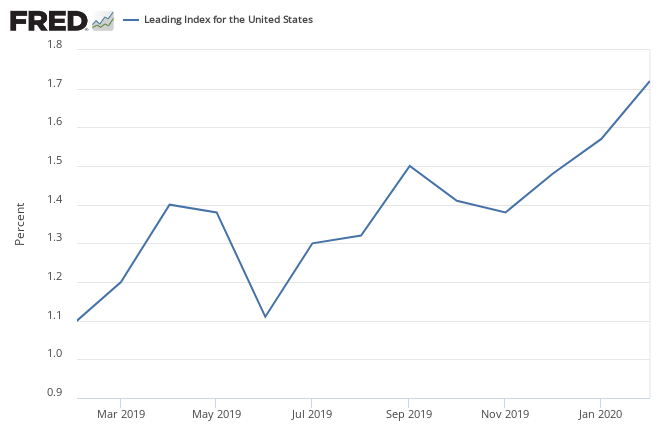
This index has been noisy, but remains above 1%, and is below mid-range of the values seen since the end of the Great Recession.
Chemical Activity Barometer (CAB)
The CAB is an exception to the other leading indices as it leads the economy by two to fourteen months, with an average lead of eight months. The CAB is a composite index which comprises indicators drawn from a range of chemicals and sectors. Its relatively new index has been remarkably accurate when the data has been back-fitted, however – its real time performance is unknown – you can read more here. A value above zero is suggesting the economy is expanding. Note that the authors of this index want to be measured against industrial production. Econintersect‘s analysis of this index is [here].

ECRI WLI Index
ECRI’s Weekly Leading Index – the methodology used in created this index is not released but is widely believed to be monetary based. Econintersect‘s review of this index is [here].
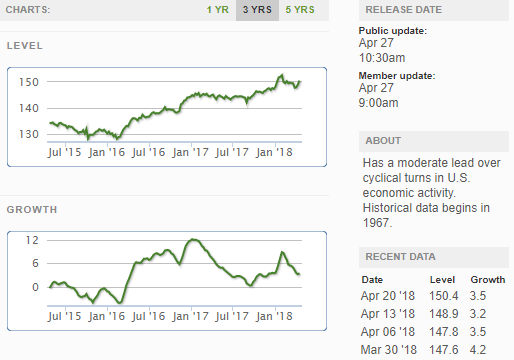
The Conference Board’s Leading Economic Indicator (LEI)


Leave A Comment