
The headlines say construction improved month-over-month but was on the lower end of expectations.

Analyst Opinion of Construction Spending
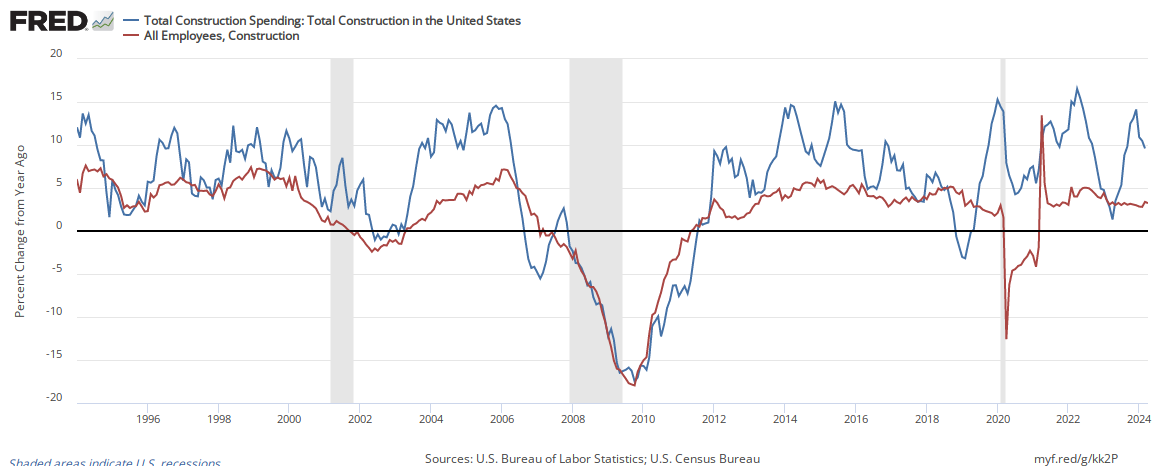
The rolling averages improved – but because of backward revision, it is lower than the year-over-year level published last month. Also, note that inflation is grabbing hold, but it moderated this month somewhat.
The employment gains currently are generally correlating with construction spending.
Econintersect analysis:

US Census Analysis:
Construction spending (unadjusted data) was declining year-over-year for 48 straight months until November 2011. That was four years of headwinds for GDP.

This month’s headline statement from US Census:
Construction spending during July 2018 was estimated at a seasonally adjusted annual rate of $1,315.4 billion, 0.1 percent (±1.5 percent)* above the revised June estimate of $1,314.2 billion. The July figure is 5.8 percent (±1.8 percent) above the July 2017 estimate of $1,242.8 billion. During the first seven months of this year, construction spending amounted to $740.5 billion, 5.2 percent (±1.2 percent) above the $703.7 billion for the same period in 2017.
PRIVATE CONSTRUCTION – Spending on private construction was at a seasonally adjusted annual rate of $1,010.9 billion, 0.1 percent (±0.7 percent)* below the revised June estimate of $1,011.9 billion. Residential construction was at a seasonally adjusted annual rate of $560.1 billion in July, 0.6 percent (±1.3 percent)* above the revised June estimate of $556.7 billion. Nonresidential construction was at a seasonally adjusted annual rate of $450.9 billion in July, 1.0 percent (±0.7 percent) below the revised June estimate of $455.3 billion
PUBLIC CONSTRUCTION – In July, the estimated seasonally adjusted annual rate of public construction spending was $304.5 billion, 0.7 percent (±3.0 percent)* above the revised June estimate of $302.3 billion. Educational construction was at a seasonally adjusted annual rate of $71.6 billion, 2.1 percent (±5.9 percent)* above the revised June estimate of $70.1 billion. Highway construction was at a seasonally adjusted annual rate of $94.2 billion, 0.4 percent (±7.1 percent)* above the revised June estimate of $93.8 billion.


Leave A Comment