This morning’s employment report for June showed a 222K increase in total nonfarm payrolls, surprising forecasts. The unemployment rate ticked upward from 4.3% to 4.4%. The Investing.com consensus was for 179K new jobs and the unemployment rate to remain at 4.3%. April and May nonfarm payrolls were revised for a total gain of 47K.
Here is an excerpt from the Employment Situation Summary released this morning by the Bureau of Labor Statistics:
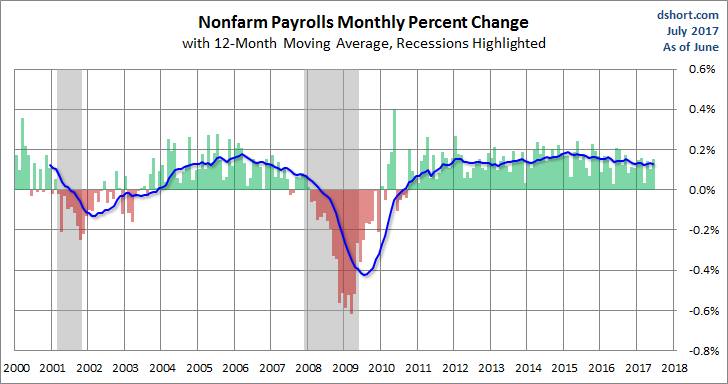
Total nonfarm payroll employment increased by 222,000 in June, and the unemployment rate was little changed at 4.4 percent, the U.S. Bureau of Labor Statistics reported today. Employment increased in health care, social assistance, financial activities, and mining.
Here is a snapshot of the monthly percent change in Nonfarm Employment since 2000. We’ve added a 12-month moving average to highlight the long-term trend.

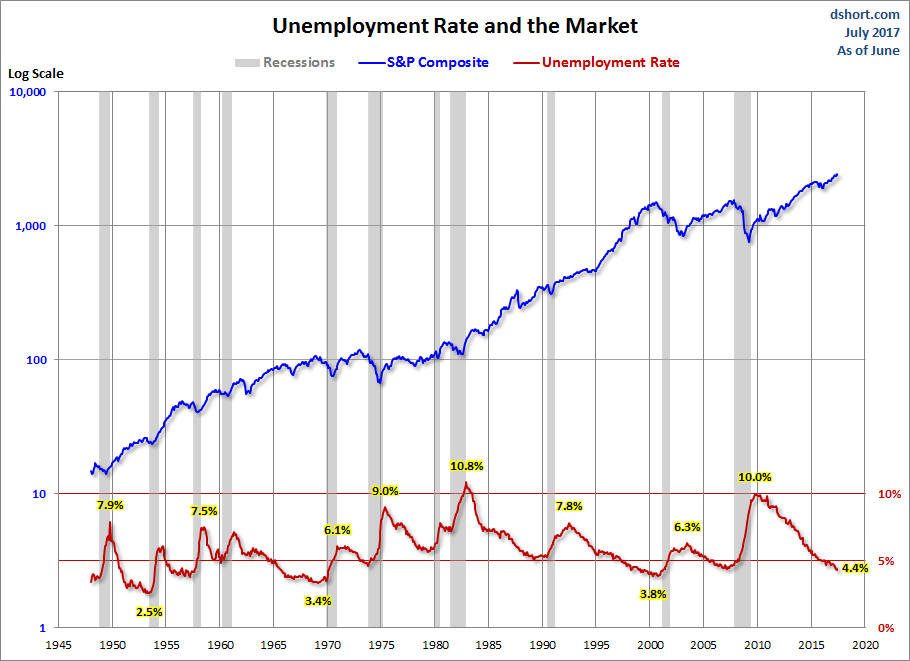
The unemployment peak for the current cycle was 10.0% in October 2009. The chart here shows the pattern of unemployment, recessions and the S&P Composite since 1948. Unemployment is usually a lagging indicator that moves inversely with equity prices (top series in the chart). Note the increasing peaks in unemployment in 1971, 1975 and 1982. The mirror relationship appears to be repeating itself with the most recent and previous bear markets.
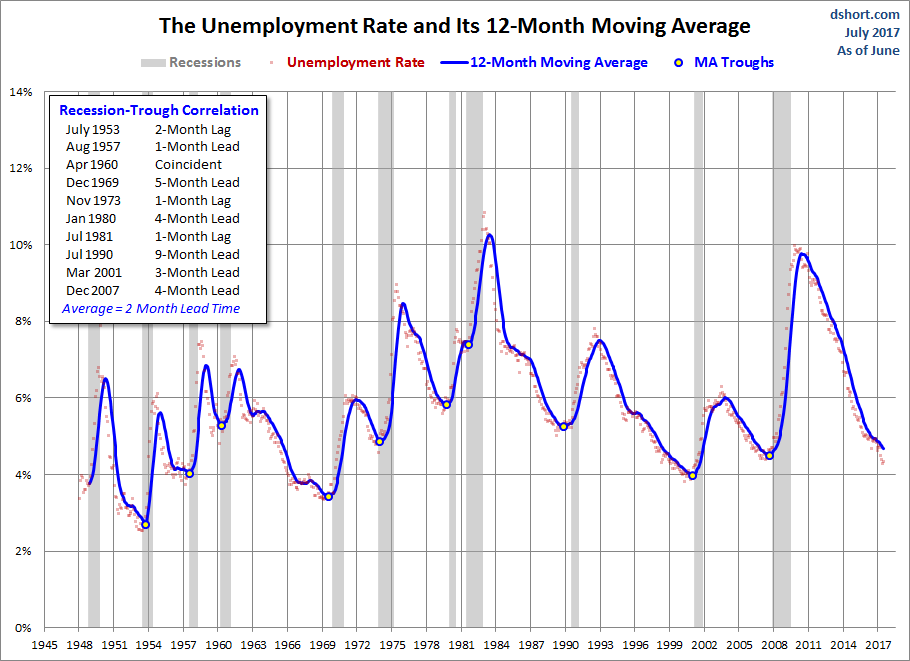
Now let’s take a look at the unemployment rate as a recession indicator or more specifically the cyclical troughs in the UR as a recession indicator. The next chart features a 12-month moving average of the UR with the troughs highlighted. As the inset table shows, the correlation between the MA troughs and recession starts is remarkably close.
We’ve added another chart to illustrate the reality of the unemployment rate – the unemployment rate divided by the labor force participation rate.


Leave A Comment