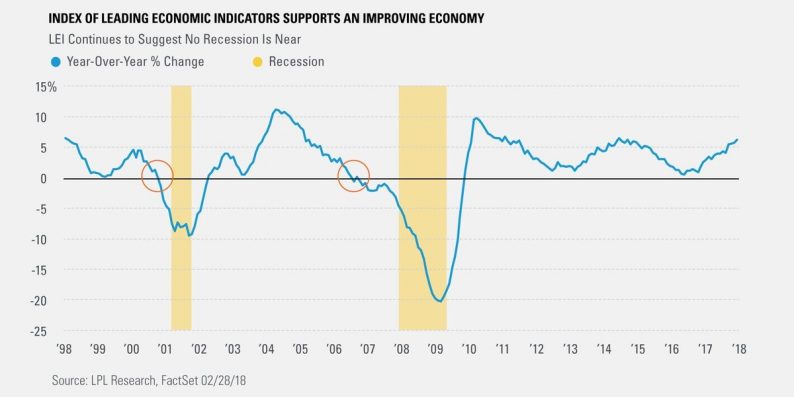
Leading Indicators – Record High
The August Conference Board leading indicators were up 0.4% month over month which missed the consensus for 0.5% growth. The July Conference Board leading index was revised to show 0.7% growth instead of 0.6% growth.
Even though the leading index is supposed to lead the economy, they are laggards in the sense that the data in the index was already known. The leading indicators were led higher by the strong ISM manufacturing orders.
On that point, it’s fair to say the leading indicators are biased to the upside since the ISM manufacturing report didn’t accurately portray the manufacturing economy in August.
The manufacturing sector actually lost jobs according to the initial BLS report. It wasn’t as strong as the PMI suggested.
Credit, interest rates, consumer expectations, and stock market metrics were also all strong. It’s not like the economy is cratering. There’s a fine line between exceptional growth and decent growth, but it’s worth recognizing. Building permits and existing homes sales were the weak parts of this index.
As you can see from the chart below, when the leading index is at a record high it means a recession isn’t coming in the intermediate term. As you can see, it fell off its record high 20 months before the last recession.
To be clear, this data is far from a guarantee. It’s only as good as the metrics which make it up. Since the stock market isn’t a perfect measurement of the future economy, this stat isn’t perfect either.
Secondly, you can’t use the stock market’s year over year performance to predict future returns. Stocks go up until they don’t. There’s no insight there.
Leading Indicators – Housing Starts Beat Estimates & Permits Miss
The seasonally adjusted August housing starts were 1.282 million which beat estimates for 1.24 million. They also beat the July starts which were revised from 1.168 million to 1.174 million.


Leave A Comment