
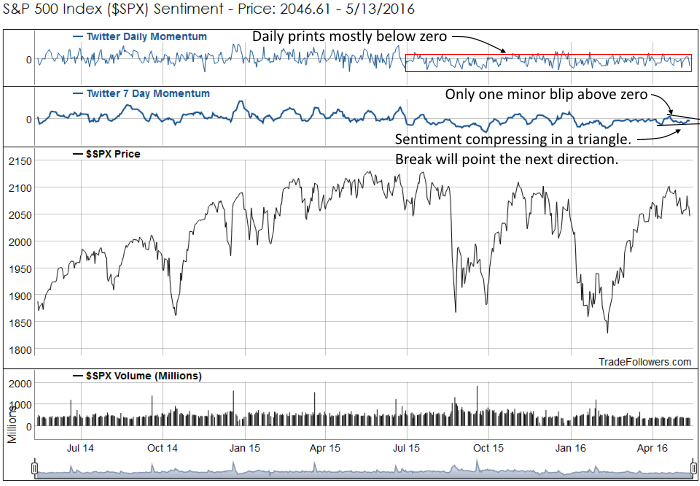
During the strong rally out of the February lows, 7 day momentum and sentiment for the S&P 500 Index (SPX) generated from the Twitter stream only had on minor move above zero. Daily prints for Twitter sentiment continue with a pattern of prints mostly below zero. That pattern has been in place since July 2015. Market participants just can’t get bullish. On the bright side, since late February, they aren’t getting very bearish either. Another important pattern on this chart is the triangle being painted by 7 day momentum. If the triangle is broken the odds favor a sustained move by price in the same direction. You can see the daily Twitter sentiment chart for SPX here.
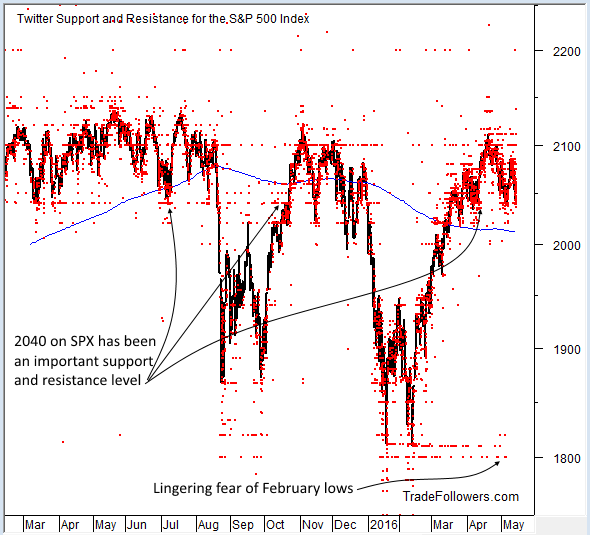
As a sign of lingering fear, we have price targets tweeted by traders on Twitter for SPX. The February low near 1810 is still being tweeted as a possible retracement level. Fear of the January decline has slowed a bit, but the current dip is bring it back. Currently, the 2040 area is the most important level. It has been both support and resistance for over a year. The bulls want this level to hold, however 2020 on SPX is a minor support level near the 200 day moving average that may act as a magnet.
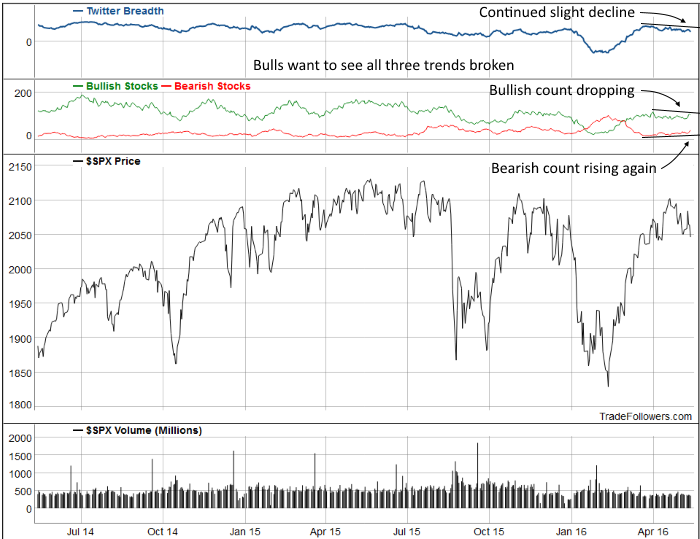
Breadth calculated between the count of bullish and bearish stocks on Twitter over the past month continues its slow decline. The bullish count is falling and the bearish count is rising. Bulls want to see all three trends broken. You can see the daily breadth chart here.
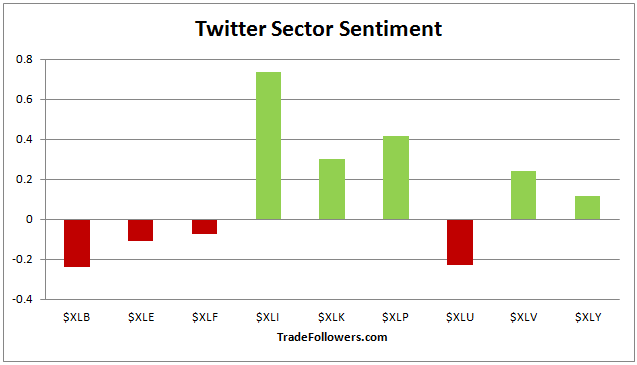
Sector sentiment was mixed over the past week.
Conclusion
Bearishness and fear continue to linger. 7 day momentum can’t get above zero, daily sentiment readings continue to paint a bearish pattern, there are renewed calls for a decline to 1810, and breadth continues to decline. For the moment the bears are in control. Bulls want to see 7 day momentum move back above zero and its down trend line accompanied by breadth breaking above its down trend line.


Leave A Comment