
There are some signs US consumers are beginning to save up a little and cut down on credit card debt. If – big IF – sustained, this will have consequences for the economy, not to mention stocks.
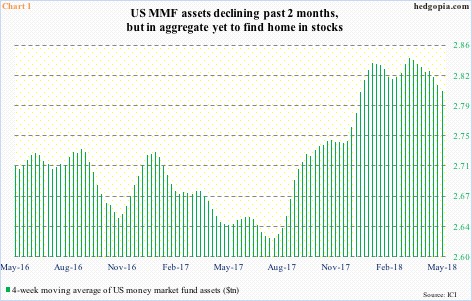
In general, a drop in money-market fund assets tends to bode well for stocks. Not of late, though.
The four-week moving average of US money-market assets peaked in the week to March 7 at $2.84 trillion. By Wednesday last week, this had dropped to $2.8 trillion (Chart 1). In the aggregate, this money did not find a home in stocks. Between the periods, US-based funds (including ETF’s) lost $10.1 billion (courtesy of Lipper.com).
As well, beginning the week ended March 7 through Monday this week, three S&P 500-focused ETF’s – SPY (SPDR S&P 500 ETF), VOO (Vanguard S&P 500 ETF) and IVV (iShares core S&P 500 ETF) lost a combined $13.8 billion (courtesy of ETF.com). Another $383 million came out of QQQ (PowerShares QQQ ETF), while IWM (iShares Russell 2000 ETF) and IJR (iShares core S&P small-cap ETF) took in $3.1 billion.
If this is the beginning of a trend, these dynamics will have implications for equities, particularly so as signs are emerging that US households of late are less profligate.
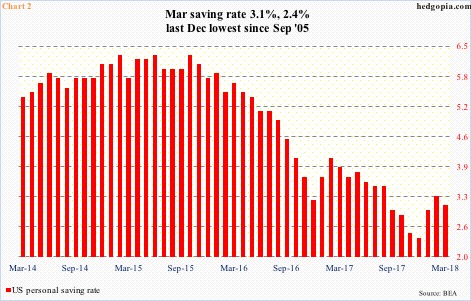
In March, the personal saving rate fell two-tenths of a percentage point month-over-month to 3.1 percent, but has risen from 2.4 percent last December. That was the lowest since 2.3 percent in September 2005. As recently as October 2015, the saving rate was 6.3 percent (Chart 2).
The rise in the saving rate is also coming at an interesting time. The Tax Cuts and Jobs Act of 2017 was signed into law on December 22. It is possible the money from the tax cut is being saved up or used to pay down debt.
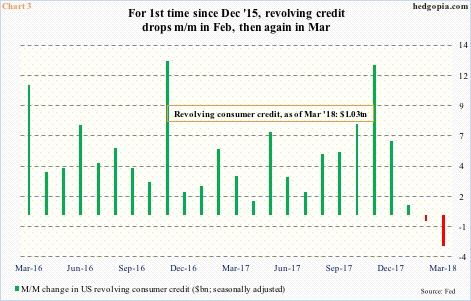
Seasonally-adjusted consumer credit in March stood at $3.87 trillion, up from $2.59 trillion when Great Recession ended. Between the periods, student loans went from $712.3 billion to $1.52 trillion and auto loans from $742 billion to $1.12 trillion.


Leave A Comment