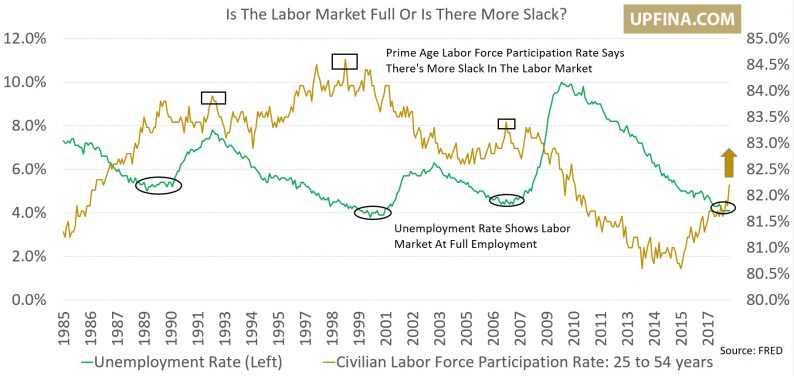
The March BLS monthly jobs report was a disappointment in terms of total job creation as only 103,000 were added instead of the 175,000 expected. Furthermore, the report missed the lowest expectation which was for 112,000. It’s important to recognize this is a volatile data point. The February job growth was revised higher from 313,000 to 326,000. February was a huge month and March was weak. When you average the two together, you get 215,000 which is a solid number and higher than the labor force growth, implying the labor market still has more slack (quantity of unemployed labor).

Labor Market Not Full
A full labor market, which is one without slack, signals the economic cycle is likely near its end.
The chart below is the year over year total nonfarm payroll growth.
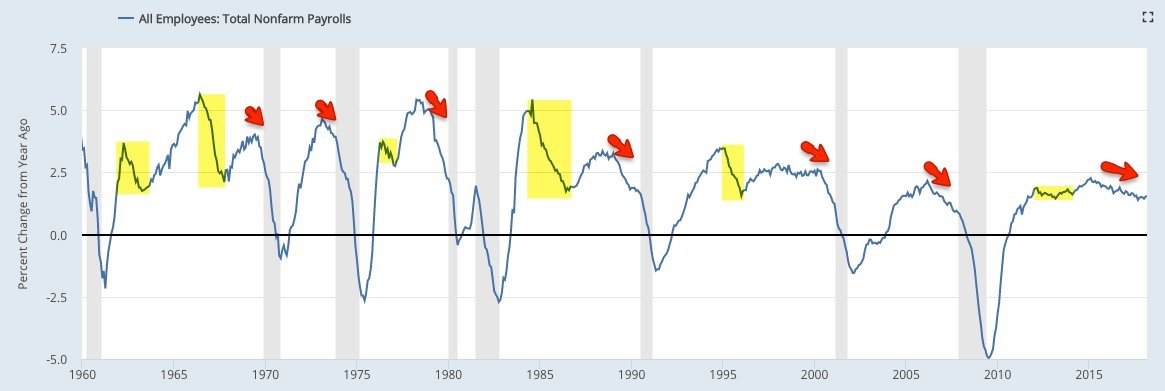
Year Over Year Job Growth
The yellow highlights show when the labor market had a mid-cycle slowing period which the labor market recovers from. The red arrows signal the final growth peaks which eventually lead to a sharp downdraft right before the recession. There’s an arrow near the current period because growth peaked in February 2015. Unlike previous cycles, the growth peak hasn’t led to a recession soon afterwards. This might be because the labor market started the cycle with a high amount of slack because the 2008 financial crisis caused severe weakness in the job market. The July 2009 year over year decline was the worst since October 1949.
Don’t Focus On The Unemployment Rate
The charts below show a few of the most prevalent labor market indicators.
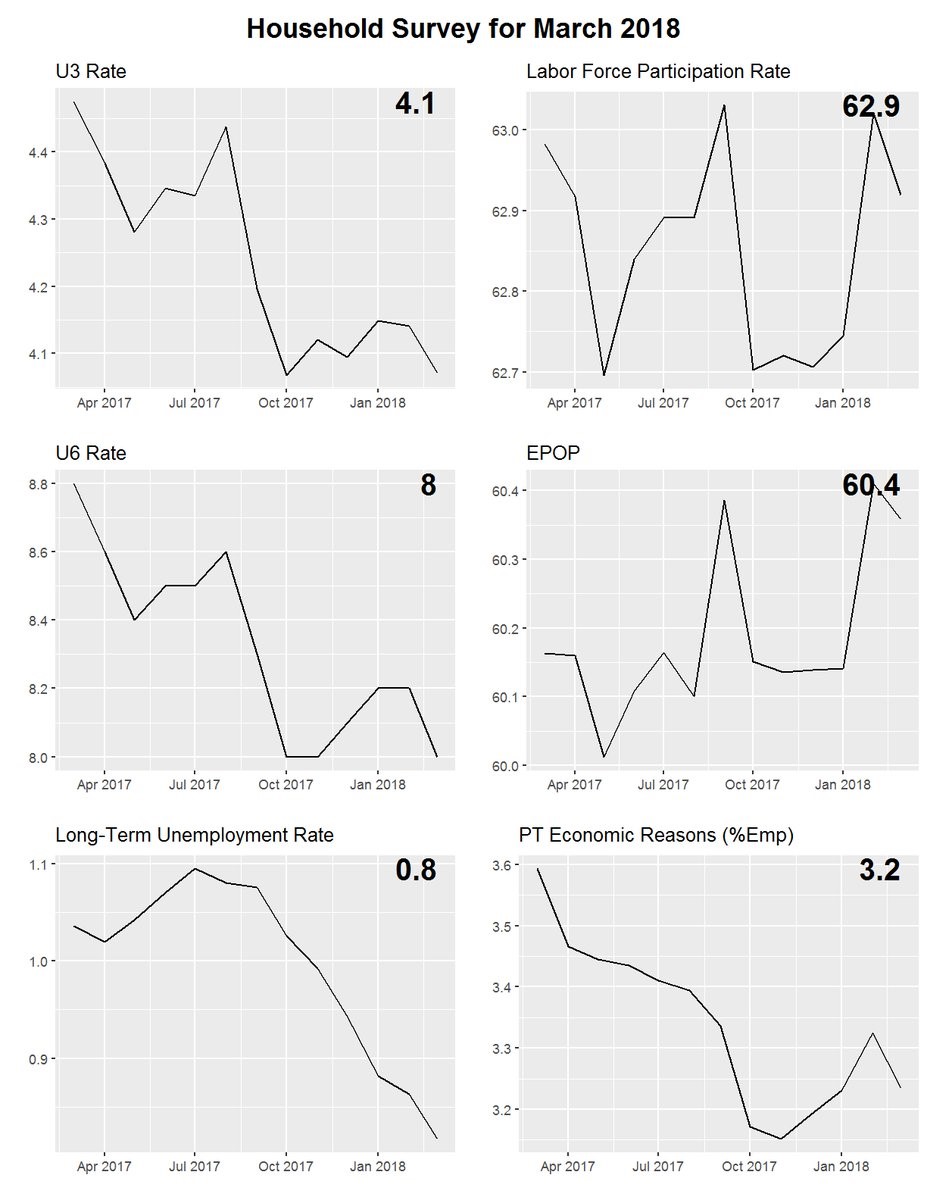
Overview Of The March Labor Report
Some claim the unemployment rate stabilizing instead of falling since October means the labor market is weakening, but that’s simplistic analysis. There’s a lot more to the labor market than this statistic. Those only looking at the U3 headline unemployment rate have been wrongly predicting that the labor market was full for a few years.


Leave A Comment