
It is a good sign for the stock market when Regional Banks are participating in the advance because it indicates rates are rising due to some strength in the economy. So how do we interpret this chart below that shows the Regionals trending sideways all year?
First, I would say they got ahead of themselves in November of last year, and, second, they look like they are breaking out higher now and maybe that is all that matters? If they continue to break higher, then we have to assume it is a confirmation for the general market.

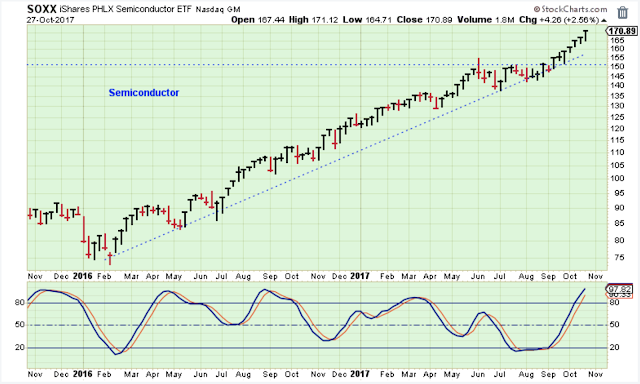
Below is another really important index. Tech has been the market leader and this index leads Tech higher or lower. This is a really good looking chart. The trend looks extended, but until the trendline breaks I am assuming higher prices for this index and the general market.
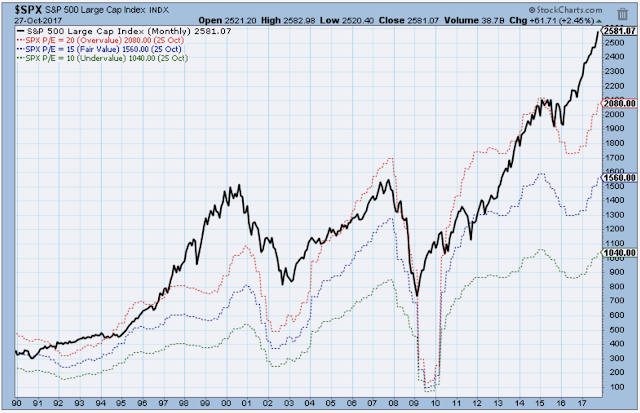
Okay, this chart is scary, but, similar to the late 1990’s, it shouldn’t scare us out of the market because it really seems as though PE multiples are controlled by interest rates.And, as long as we have such low rates… etc, you’ve heard it all before.
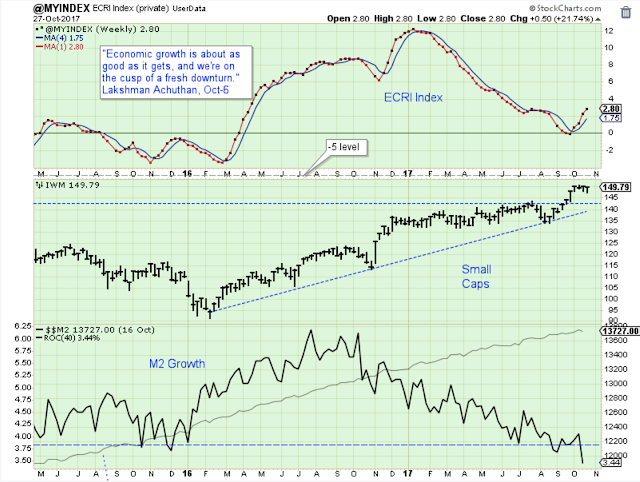
The ECRI index continues to point higher, and the Snall Caps continue to hold their uptrend. Both good signs for the longer-term outlook.
The trend for M2 growth is weak and hasn’t started improving. My sense is that this is an important indicator, but it is hard to apply. This low M2 growth is probably one of the reasons for recent low levels of inflation, but now we are getting way out of my expertise.So I am going stop right there and just say that low M2 growth probably works against certain areas of stock market such as the precious metals and energy stocks.
Outlook
The ECRI index has bottomed out and is pointing higher.


Leave A Comment