
Written by Austrolib
Assuming the fundamental argument of the gold bulls is correct and that:
the question is did we just see a major trend change? What follows are three major signals that we have…[and] that this stage of the gold bull market since 2001 could be the wildest yet.
Signal #1 – 2008 vs. 2016 Bottom
2008
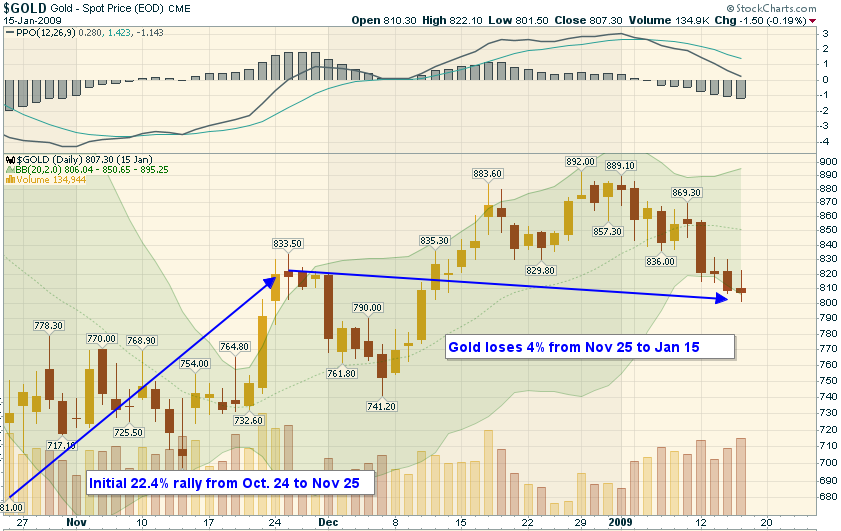
The last time a gold bear market bottomed, albeit a little bitty one by time, was March to October 2008. In that window, gold dropped 34% in 8 months. The climb out of that bear looked like this:
Chart 1
Importantly, the rally was confirmed by gold stocks as measured by the HUI Gold Bugs Index, below. The HUI is followed closely by the Market Vectors Gold Miners ETF (NYSEARCA:GDX):
Chart 2
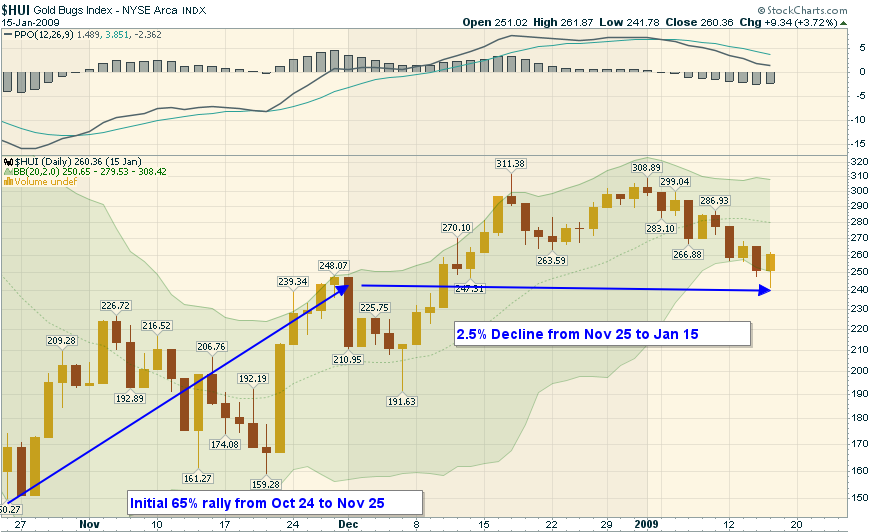
The fact that gold miners were outperforming gold both on the way up and on the way down was a good sign the bottom was in. Overall, in that time period, gold stocks outperformed the underlying metal by about 3x.
2016
Fast forward to now, and we have the same pattern. Here’s gold from January 19th when the HUI last bottomed, to March 18th, 2016:


Leave A Comment