
About four years ago I went to a Bloomberg hosted talk on Market Cycles. I have been wracking my brain and Google trying to find the presentation and speaker name (which was available on line) but I thought the talk interesting enough to market in my Google calendar the date for the New Moon in October 2017, which was a focus point convergence of a number of market cycles and potentially a significant market top event (the countdown clock in the sidebar). The years have since ticked by and we are not just a couple of days from the October 2017 New Moon. The market has at least cooperated by sitting at new all-time highs but whether this evolves into a major top remains to be seen. I’m mad with myself that I can’t find in my pinboard or delicious bookmarks the link so all I can say is the day will soon be upon us and let’s see what happens from there…
Other than speculating on the big ‘what-ifs’ there is very little to say about the market in recent days. Action is tight and near resistance or just above major support. Volume has been modest. And with Trump pushing the media norm to outlandish there is very little a rational news piece can do to mark a contributing influence on the market. One consistent marker close to major tops is the unemployment level, which is near maximum employment and in recent years has been followed by a recession (Y2K Tech Top and 08 Credit Crisis).

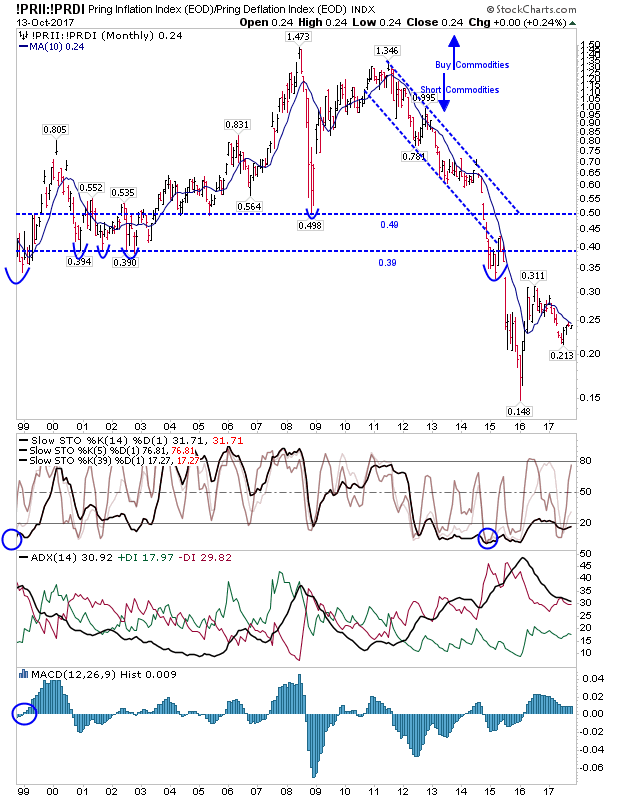
Pring’s Inflation: Deflation Index plumbed to a new sub-0.40 zone in 2015 and it’s questionable how long it can stay here with what looks a clear spike low in 2016 and current retest; a move above 0.311 confirms the low and a new era of inflation.
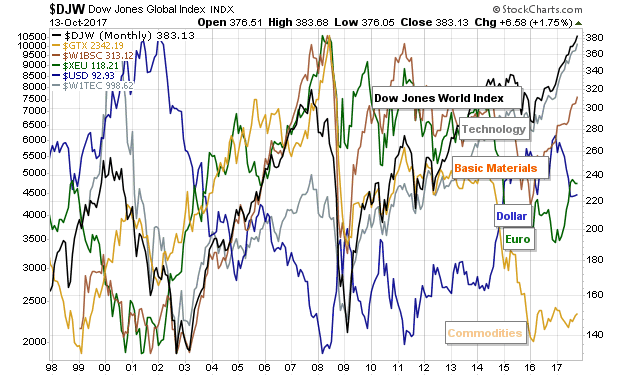
My overall market watch shows the extreme high/low divergence between World Equity Highs and Commodity Lows. This chart suggests commodities are the go-to long play.
This chart I got from J.C. Parets on the relationship between Discretionary and Staples stocks also suggests we may be approaching a resistance level; although markets don’t appear to head south until the last swing low is breached (at 1.435 in this instance) which could be another 1-2 years away – if not longer as the 2005 peak and false 1.56 swing low break illustrates.


Leave A Comment