

In last year’s market outlook for 2017, I anticipated a rise of around 11% in U.S. equities, in general, to place the S&P 500 Index at just above the 2400 level by the end of the year (my post was written on December 1, 2016, so my calculations and forecast hadn’t incorporated a further 80-point rally that occurred during that month until year-end).
In my post of November 26, 2016, I was projecting a rally in the SPX to around 2700 by the next U.S. Presidential election in 2020. Markets have certainly been much more robust this year than I anticipated, as this level has almost been hit already. It rallied to an all-time high of 2657.74 on November 30 and closed on December 1 at 2642.22.
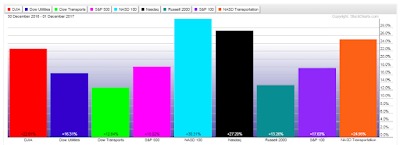
At the time of writing this post on December 2, you will see that, of the 9 Major Indices, the S&P 500 Index has gained 18.02% year-to-date, as shown on the first graph below, while the Nasdaq 100 and Nasdaq Composite Indices have gained the most, and the Russell 2000 and Dow Transport Indices the least.
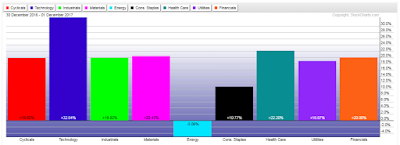
With regard to the 9 Major Sectors, Technology has gained the most year-to-date at 32.84%, with six others at around 20%. Consumer Staples gained 10.77%, while Energy has far underperformed at -5.06%.
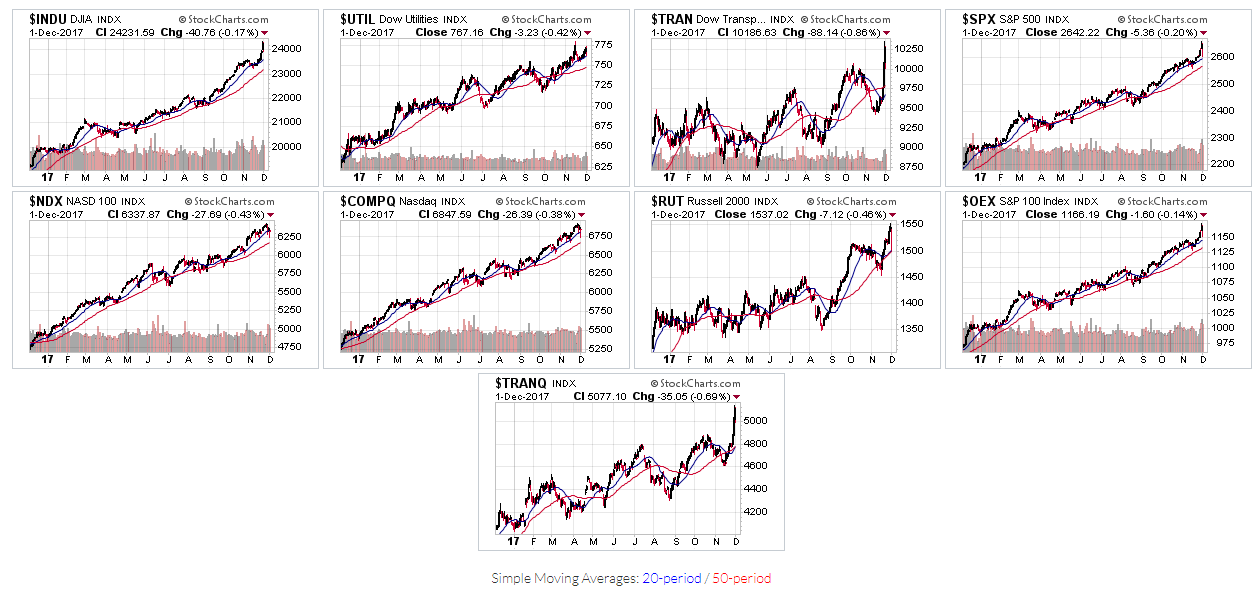
All of these Indices and Sectors are currently trading, either above, or well above, their 50-day moving averages, as shown on the following 1-year daily charts.


Leave A Comment