
The last month has been an exciting time for the U.S. stock market, where if you wanted to describe it in one word, volatile would probably be the word that best describes it!
But to understand how exciting it has been for investors and traders, we need to put the last month of stock price volatility into some historical context. Which we’ve done in the following chart showing the daily volatility as the percentage change in the closing price of the S&P 500 since 3 January 1950, which updates one we first featured two-and-a-half years ago.
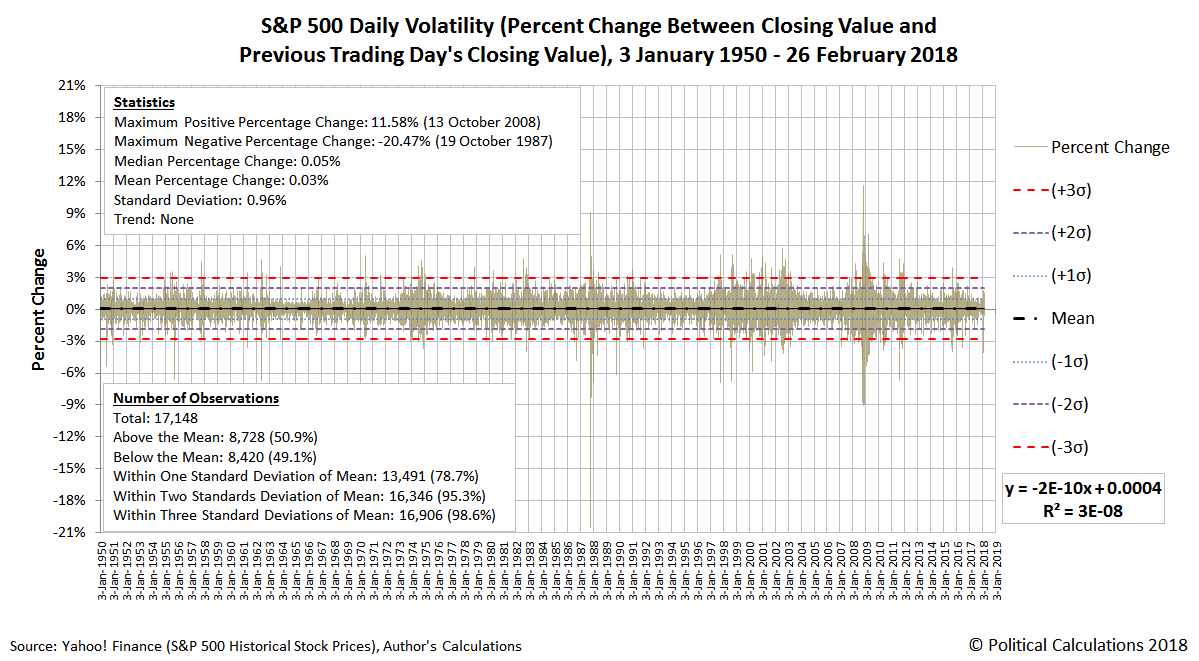
By and large, the pattern daily volatility in the S&P 500 and its predecessor indices over the last sixty-eight years and almost two months follows something that looks a lot like a normal distribution, although with considerably more datapoints (~79%) falling within one standard deviation of the flat, near-zero mean trend line than would be expected if that pattern of variation really applied (~68%).
Conveniently, one standard deviation is roughly equivalent to a percentage change of 1%.
Otherwise, about 95% of all the day-to-day datapoints fall within two standard deviations (or 2%) of the mean, and 99% of all the datapoints fall within three.
Datapoints that fall outside one standard deviation of the mean would, therefore, be evidence of a heightened level volatility for stock prices, while falling more than three standard deviations (or 3%) away from the mean would be evidence of an “extraordinary” amount of volatility.
Our second chart zooms in on the last month for the S&P 500, from Friday, 26 January 2018 through Monday, 26 February 2018.
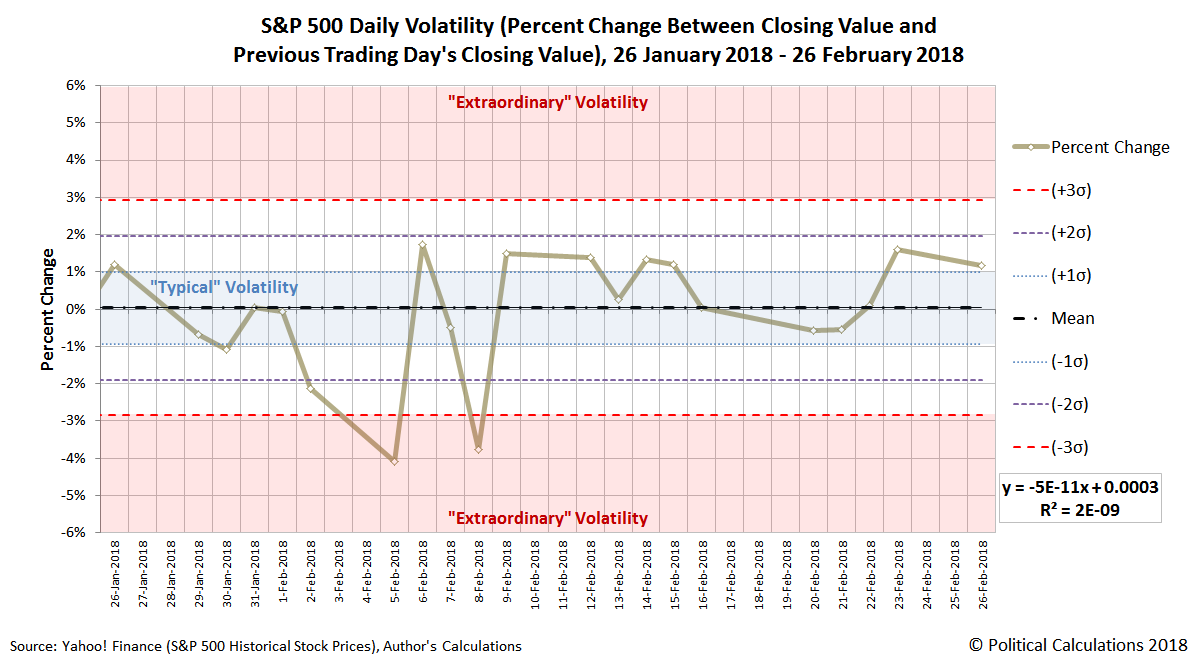
In this chart, we can see that over the past calendar month covering some 21 trading days, 9 of the datapoints fall within the most “typical” range that we would expect based on the historical data, which is between 7 and 8 fewer than would be expected for that period of time.
The remaining 12 days are consistent with at least a heightened level of volatility in the S&P 500, where we would expect to see just 4 or 5 such days during the course of a month’s time. Of those days, two fall more than three standard deviations from the mean, indicating just how extraordinary volatile the month has been for the index.


Leave A Comment