
The Producer Price Index year-over-year inflation marginally declined from 2.5 % to 2.4 %.

Analyst Opinion of Producer Prices
Mostly the data shows Producer Price data was treading water. In general, Goods inflation surge trend has moderated whilst services inflation is now on the high end of readings seen over the last year. This month’s inflation data was around expectations.
The PPI represents inflation pressure (or lack thereof) that migrates into consumer price.
The producer price inflation breakdown:

In the following graph, one can see the relationship between the year-over-year change in intermediate goods index and finished goods index. When the crude goods growth falls under finish goods – it usually drags finished goods lower.
Percent Change Year-over-Year – Comparing PPI Finished Goods (blue line) to PPI Intermediate Goods (red line)
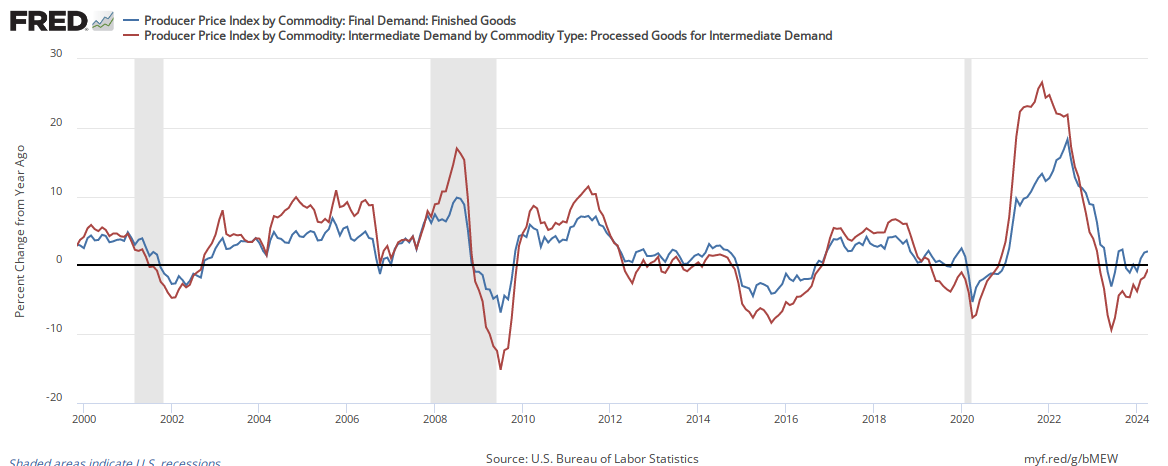
Econintersect has shown how pricing change moves from the PPI to the Consumer Price Index (CPI). This YoY change implies that the CPI, should continue to come in around 2.5 % YoY.


Leave A Comment