
From a fundamental perspective, there are many ways to get a target price. Without looking at a chart, there is no way to know the tendency of getting there. There is noway around it, you gotta look at the charts.
While many analysts seem content at setting a target near the all-time high of around 60 dollars, I am ignoring that.Microsoft Corporation (Nasdaq:MSFT) stock will break through that target, and when it does,it will be violent.

Remember the SPX? Remember how no one thought we would break-through that 2120 level? What these analysts fail to observe is that the more times a level fails, the more powerful the break from it. You can only hold a level for so long.
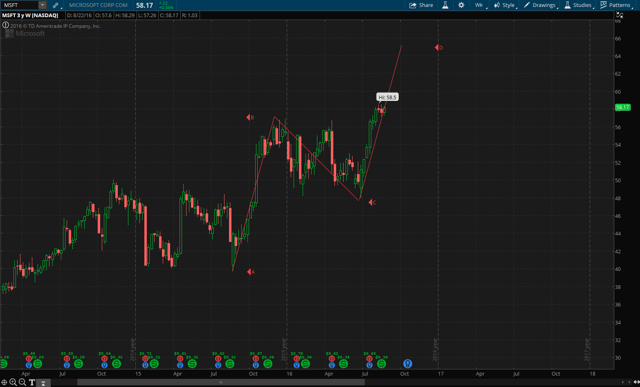
When I look at a weekly chart, I am currently seeing a long-term ABCD wave pattern in progress for Microsoft stock price. This is one of the oldest reoccurring patterns. Don’t get hung up on the text book definition of this pattern, it will drive you crazy as you will miss the bigger picture of the current development. Also, don’t get hung up on the terminology.
If you are an Elliot wave practitioner, you know this is a Wave three in progress. And, wave three is typically the largest and most profitable wave.
I can even call this a harmonic, Fibonacci pattern or even market symmetry. The point is whatever you call it and as long as you are able to identify it, the results are the same. Think of it as the same bottle of wine poured in different glasses.


Leave A Comment