The economy is like a large ship in at least one way: Neither a ship nor the economy can turn on a dime.
It takes miles of clear blue ocean and time to safely turn a large ship. The same is true for the economy. It takes time for the economy to change direction.
That reality of slow change means 2018 looks like a good year for the U.S. economy. That’s because a key indicator is ending this year in an uptrend.
The Industrial Production Index Through Booms and Busts
Industrial production is rising, but it’s only been rising for about a year. In the past, uptrends in this indicator generally continued for at least five years. Its young trend bodes well for next year, as the trend is likely to continue.
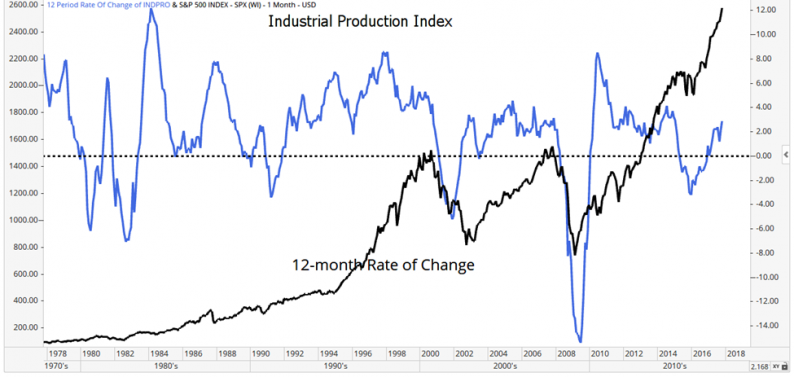
The chart below shows the year-over-year percentage change in the Industrial Production Index (IPI) as the blue line. The S&P 500 index is the black line in the chart. Notice how trends in the two indexes tend to be in the same direction.
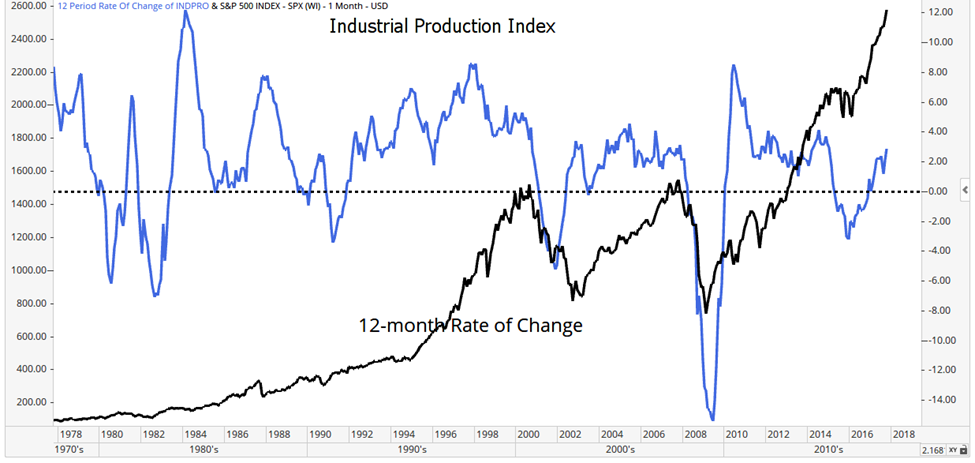
The Federal Reserve calculates the Industrial Production Index. It’s designed to measure the inflation-adjusted output of all manufacturing, mining, and electric and gas utilities located in the United States.
Since the Fed calculates the index, it’s obvious Fed officials believe it’s important data. History shows the data series is also important to stock market investors.
The chart above is a long-term chart showing almost 40 years of data. Through booms and busts, the two indexes have almost always moved in the same direction.
Skeptics point out manufacturing isn’t as important as it was 40 years ago. That might be true, but the IPI includes the production of electricity. If bitcoin mining, for example, is now more important to the economy than manufacturing cars, the index will capture that change.
This index tracks the stock market in addition to the economy. It is one of the few economic indicators that stock market investors should follow.


Leave A Comment