
Over a lifetime Holding Period – do T-bills actually beat stocks?
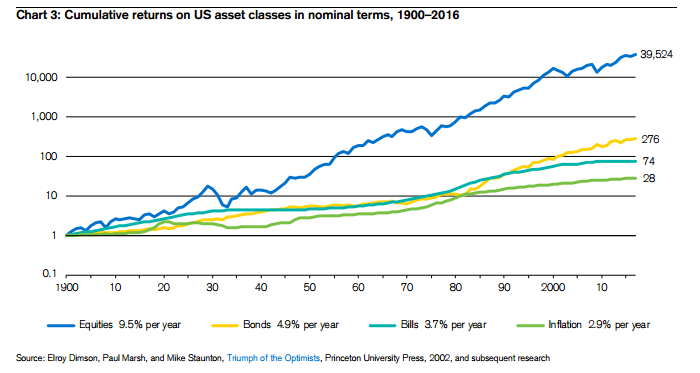
According to the Credit Suisse Global Investment Yearbook, over the long term US equities have produced a real return of 6.4% per annum since 1900 (to year end 2016). These returns have eclipsed those of the risk-free assets, Treasury Bonds, and Bills, which achieved a real return of 2.0% and 0.8% respectively over the same period. $1 invested in US equities in 1900 would have grown to $1,402 by year-end 2016, while the same amount invested in bills would be worth only $2.
However, while these figures show that over the long term, equities are by far the most lucrative asset class for investors, the chance of an investor actually being able to achieve these returns is almost nonexistent.
geralt / Pixabay
Most Stocks Underperform T-Bills Over Their Lifetime Holding Period
A new research paper, written by Hendrik Bessembinder of the W.P. Carey School of Business at Arizona State University, highlights the degree to which the odds of achieving even a market average return are stacked against the average investor.
According to the finance professor, 58% of shares fail to outperform Treasury bills over the long term. Bessembinder reached this conclusion after studying the returns of 26,000 over the period 1926 to 2015. During this period, the average monthly return for stocks was 1.13%, compared to just 0.38% for T-bills. Nonetheless, while the wider equity market outperformed the fixed income securities, only 42% of the equities considered on an individual basis outperformed, the rest produced a negative return.
These figures show to what degree survivorship bias skews market returns over the long term. Of the 42% of equities that beat T-bills over the period studied, just 4% or roughly 1,000 stocks were responsible for all of the $31.8 trillion in wealth created by US equities during the period. Furthermore, of these 1,000 stocks 86 generated half of the returns. Exxon Mobil Corp. alone accounted for about 3% of the wealth created and Apple Inc. for about 2% (to year-end 2015, considering the performance of the FAANG group over the past 18 months these returns are likely to be substantially higher today). Here are some more findings from the study:


Leave A Comment