
While most are watching U.S. equities rip higher, we’re continuing to see strength from emerging markets. Previously, we highlighted the breakout taking place in Brazil. Up 13% since we released that research, Brazil hasn’t disappointed. Though nothing is guaranteed, and price knows more than we do, we are seeing a similar development out of Russia.
Using a weekly chart of RSX (an ETF that mirrors the Russian Trading System Index), you’ll see exactly what we’re talking about.
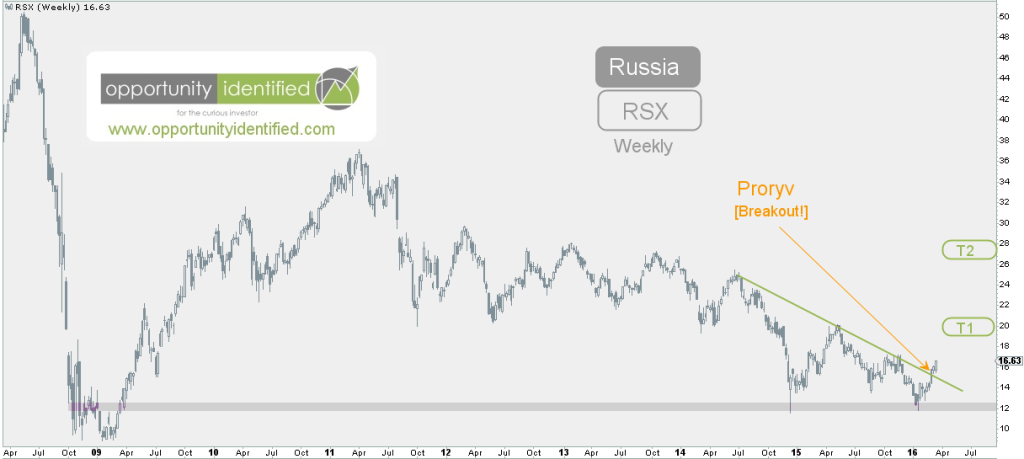
Russia has broken out of steepening downtrend that dates back to 2011. With a a 67% drawdown since then, Russian equities have been subject to significant discounting. We’re not interested in buying stocks that are in a downtrend. But when the supply and demand dynamic changes, and buyers step into the marketplace, we sit up and take notice. In late 2014, and recently again earlier this year, buyers stepped in near the 12.00 level. More importantly, there was enough buying demand to push RSX through the downtrend line (in green), signaling a potential change in trend.
We can take advantage of this opportunity by making sure we identify the risk involved with this trade. We should never enter a trade without understanding potential risk versus potential reward. Technical analysis allows us to do just that. Here’s a daily chart of RSX:
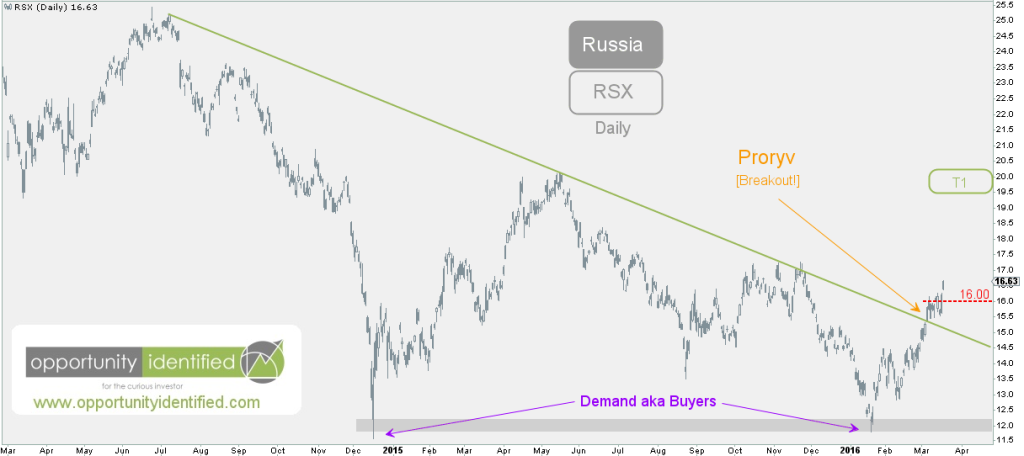
The breakout is clear. There is more demand than supply, causing prices to breakout. We like that. We also see a logical level (16.00) where buyers should step in if there is any pull back in prices. And if they don’t, we’re out of the trade. It’s as simple as that. We’re long RSX above 16.00. Below 16.00, we’re out. Bila ne bila.


Leave A Comment