
EUR/USD
4 hour

The EUR/USD could be building a head and shoulders reversal chart pattern (purple boxes), which would be confirmed once price breaks below the support trend line (blue). A bullish break above resistance (red) would invalidate the pattern and could indicate a potential uptrend continuation towards the 78.6% Fibonacci level of wave 2 (green).
1 hour
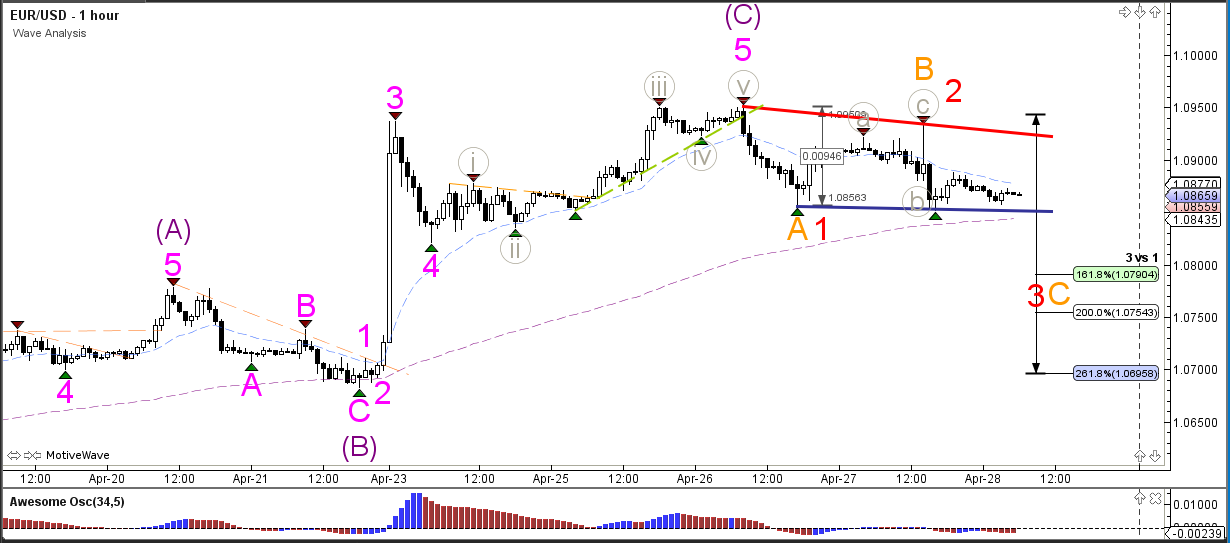
The EUR/USD has not managed to break the top as expected yesterday. This could be explained by a potential 123 (red) or ABC (orange) correction. A break below support (blue) could start the bearish continuation towards the Fibonacci targets.
GBP/USD
4 hour

The GBP/USD is challenging the resistance level (red) of the sideways zone (red/blue). A bullish break could see price challenge the round level of 1.30.
1 hour

The GBP/USD is forming an ascending wedge chart pattern which is indicated by support (green) and resistance (red/orange). A break above the resistance could see price move up towards the Fibonacci targets of wave 5 (purple).
USD/JPY
4 hour
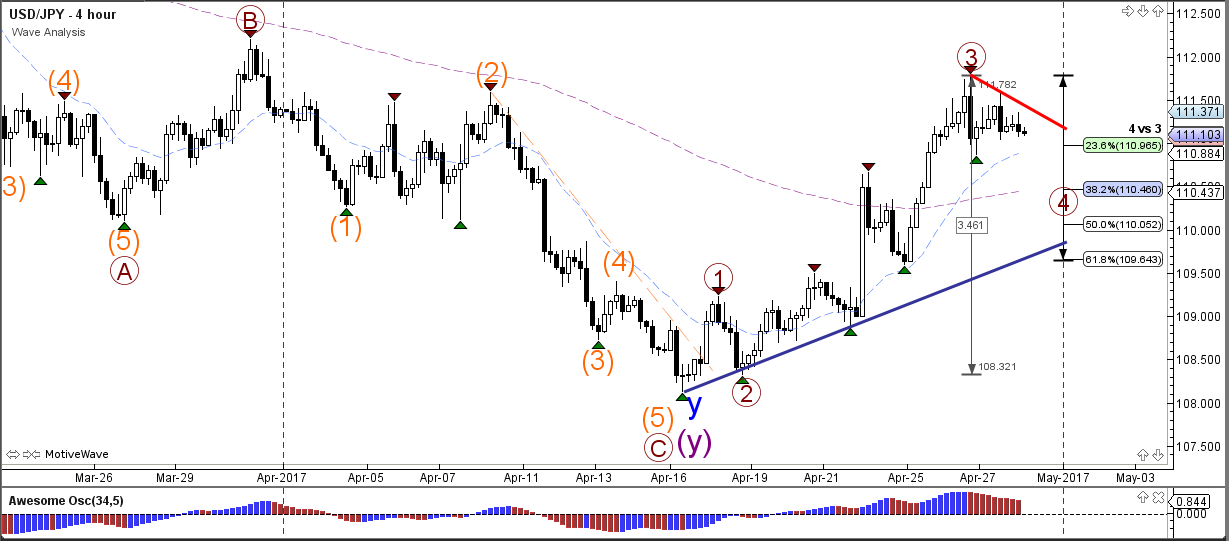
The USD/JPY seems to have completed a wave 3 (brown) and is now be building a potential wave 4 (brown) retracement if price stops at one of the shallow Fibonacci levels (23.6-50%).
1 hour
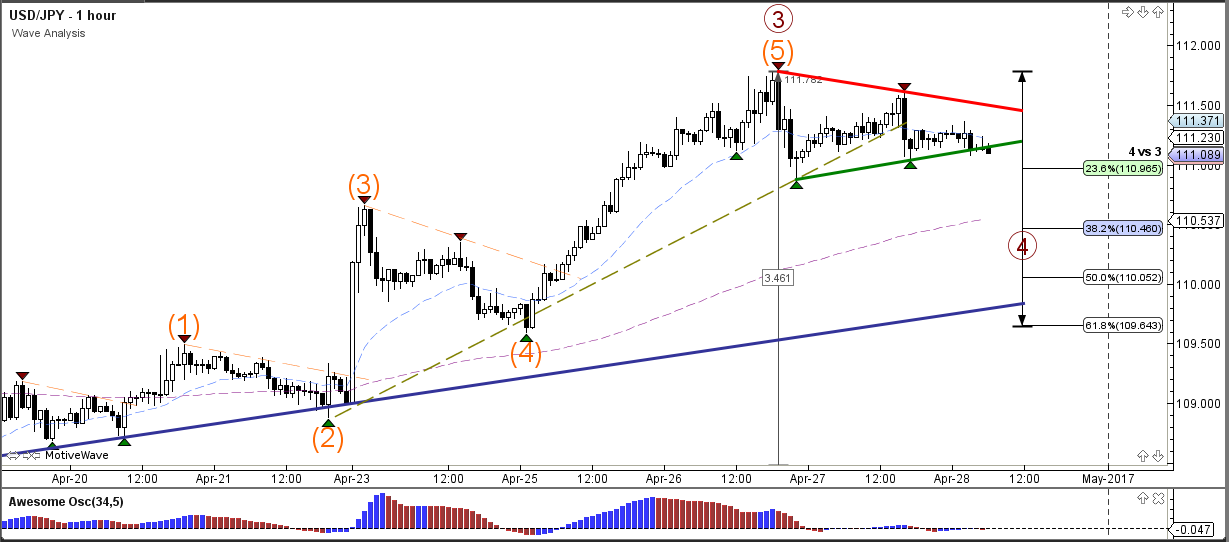
The USD/JPY is building a contracting triangle (red/green) chart pattern. A break below the support trend line (green) could see a larger retracement unfold towards the Fib levels of wave 4 (brown).


Leave A Comment