
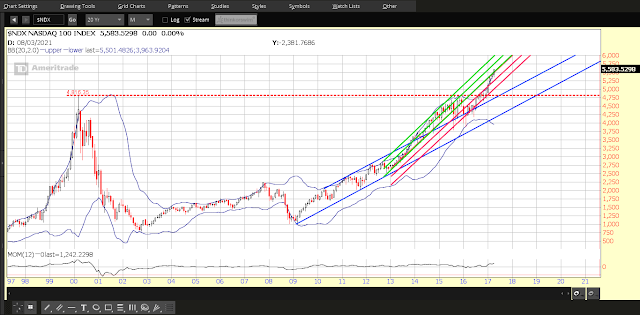
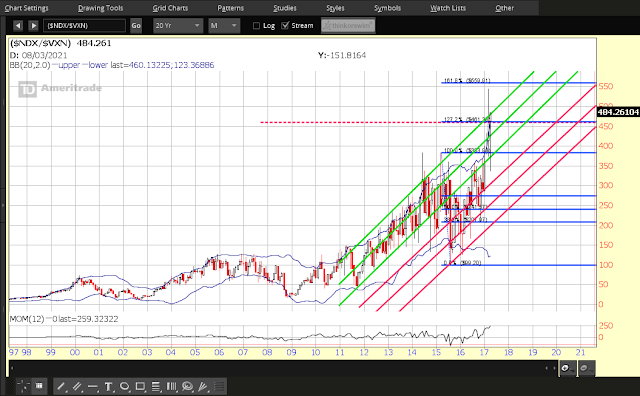
While the Nasdaq 100 Index (NDX) is busy making new all-time highs, so is the NDX:VXN ratio (VXN is the Nasdaq 100 Volatility Index), as shown on the following two Monthly charts.
What is different about these two, is that the NDX:VXN ratio has run up against major resistance (the top of its long-term uptrending channel, while the NDX has a long way to go before it does the same.
With reference to the ratio chart, a drop and hold below the 460 level (127.2% external Fibonacci retracement level) could forecast a drop down to, potentially, major support at 380 (100% Fib retracement level plus bottom of long-term channel) on this chart, or lower.
However, inasmuch as the Momentum indicator has reached a new all-time high, such a scenario may be doubtful in the near term…but could be signs of an imminent parabolic spike in NDX, followed by a blow-off drop coming sometime in the not-too-distant future.
I still think that if the markets sense that Congress is not going to deliver on any meaningful tax reform and economic stimulus packages this year, or even into next year, while the Fed is busy raising interest rates, they will lose patience and transfer funds from equities into bonds, and, possibly, into Gold, particularly if retail sales, new jobs, and higher wages don’t pick up.
But, as long as the Fed has the market’s back, I think any blow-off drop may be wishful thinking for some, and could end up being a short-seller’s nightmare, if it doesn’t materialize.
And, as I’ve mentioned here and here recently, Bonds, Technology, and volatility are key to the success of any new (sustainable) bull market in equities, in general, that may seem to be evolving, in my opinion.


Leave A Comment