
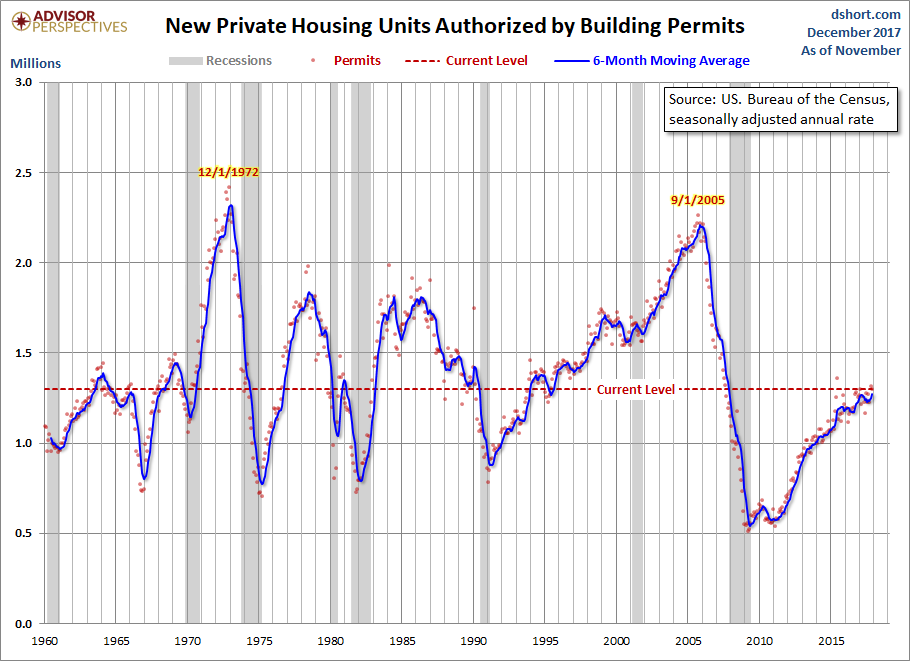
The U.S. Census Bureau and the Department of Housing and Urban Development have now published their findings for November new residential building permits. The latest reading of 1.298M was a decrease from a revised 1.316M in October and above the Investing.com forecast of 1.273M.
Here is the opening of this morning’s monthly report:
Building Permits
Privately-owned housing units authorized by building permits in November were at a seasonally adjusted annual rate of 1,298,000. This is 1.4 percent (±1.7 percent)* below the revised October rate of 1,316,000, but is 3.4 percent (±2.3 percent) above the November 2016 rate of 1,255,000. Single-family authorizations in November were at a rate of 862,000; this is 1.4 percent (±1.6 percent)* above the revised October figure of 850,000. Authorizations of units in buildings with five units or more were at a rate of 395,000 in November. [link to report]
Here is the complete historical series, which dates from 1960. Because of the extreme volatility of the monthly data points, a 6-month moving average has been included.
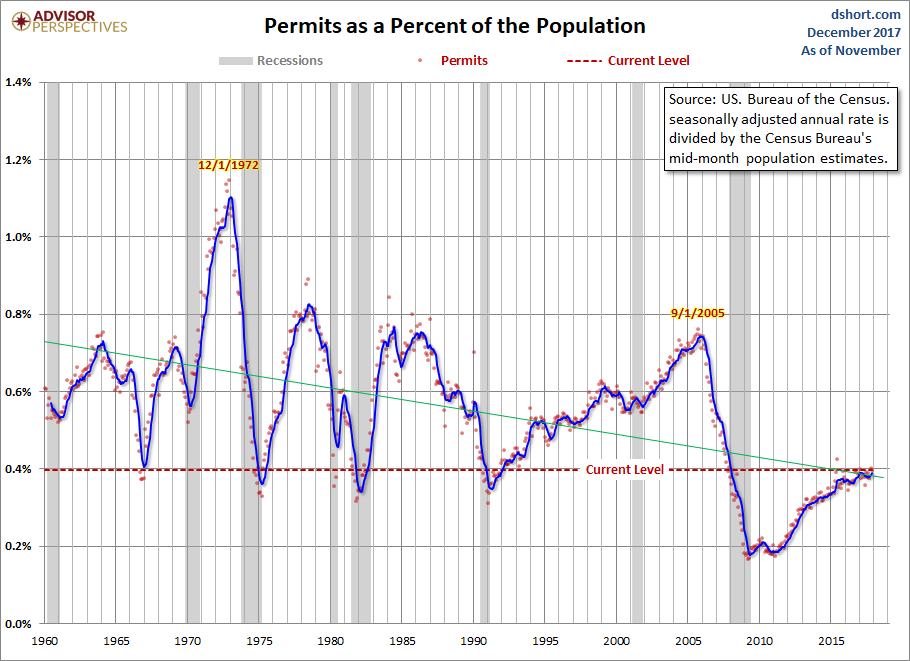
Here is the data with a simple population adjustment. The Census Bureau’s mid-month population estimates show substantial growth in the US population since 1960. Here is a chart of housing starts as a percent of the population. We’ve added a linear regression through the monthly data to highlight the trend.
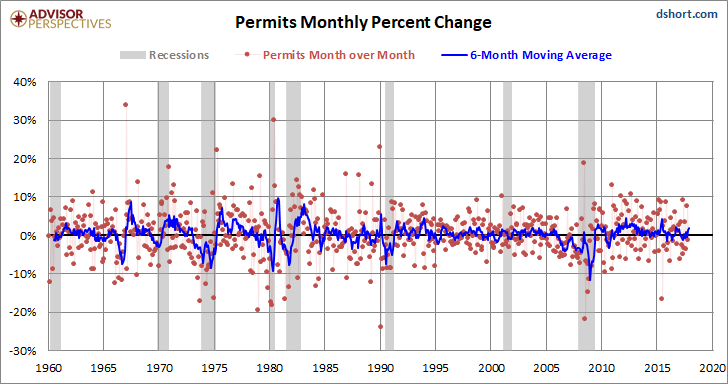
A Footnote on Volatility
The extreme volatility of this monthly indicator is the rationale for paying more attention to its 6-month moving average than to its noisy monthly change. Over the complete data series, the absolute MoM average percent change is 4.4%. The MoM range minimum is -24.0% and the maximum is 33.9%.
For visual confirmation of the volatility, here is a snapshot of the monthly percent change since 1990.


Leave A Comment