Six new stocks make our Exec Comp Aligned With ROIC Model Portfolio this month. March’s Exec Comp Aligned With ROIC Model Portfolio was made available to members on 3/15/17.
Recap from February’s Picks
Our Exec Comp Aligned With ROIC Model Portfolio (-1.5%) underperformed the S&P 500 (+1.0%) last month. The best performing stock in the portfolio was Children’s Place (PLCE), which was up 13%. Overall, five out of the 15 Exec Comp Aligned With ROIC Stocks outperformed the S&P in February.
Since inception, this model portfolio is up 24% while the S&P 500 is up 12%.
The success of the Exec Comp Aligned With ROIC Model Portfolio highlights the value of our forensic accounting (featured in Barron’s). Return on invested capital (ROIC) is the primary driver of shareholder value creation. By analyzing footnotes in SEC filings, we are able to calculate an accurate and comparable ROIC for 3000+ companies under coverage.
This Model Portfolio only includes stocks that earn an Attractive or Very Attractive rating and align executive compensation with improving ROIC. We think this combination provides a uniquely well-screened list of long ideas.
New Stock Feature for March: NVR Inc. (NVR: $2,016/share)
NVR Inc. is one of the additions to our Exec Comp Aligned With ROIC Model Portfolio in March.
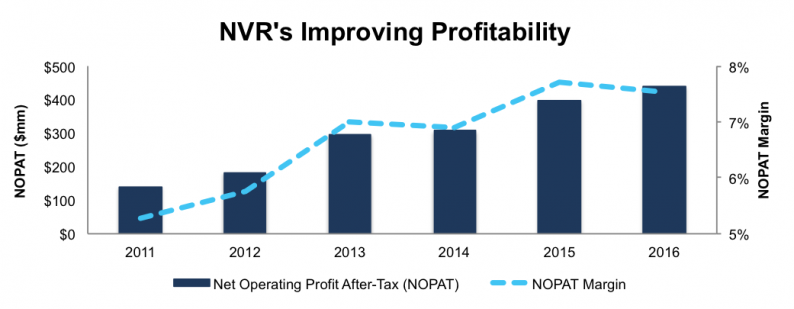
Since 2011, NVR has grown after-tax profits (NOPAT) by 26% compounded annually. Per Figure 1, NVR’s NOPAT margin is currently just under 8%, which is up from 5% in 2011.
Figure 1: Growing Profits & Margins

Sources: New Constructs, LLC and company filings
NVR currently earns a top-quintile 21% return on invested capital (ROIC) and has generated a cumulative $821 million (11% of market cap) in free cash flow over the past five years.
Executive Compensation Aligned With ROIC Creates Shareholder Value
Return on capital has been part of NVR’s executive compensation plan since 2014. In 2016, half of NVR’s equity grants were tied to the firm’s return on capital performance. For performance-based options, vesting is subject to NVR’s return on capital relative to its peer group.


Leave A Comment