
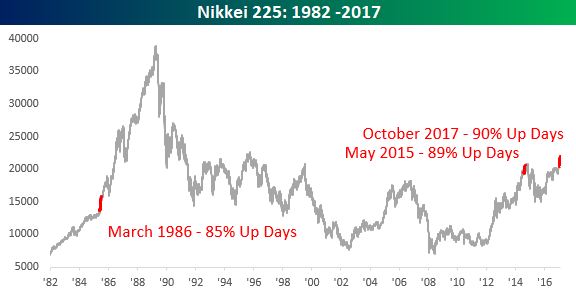
When settling into our desks this morning and checking out how international markets performed overnight, we had to do a double-take when the color next to Japan’s Nikkei 225 was actually red. Sure it was a drop of just 0.0003%, but it was a decline nonetheless. And that’s something we haven’t been accustomed to seeing for Japanese stocks this month. In fact, for the entire month of October, the Nikkei traded down on the day just two times out of 21 trading days! That works out to up days on just over 90% of all trading days and is a level of consistency that has never been seen before.
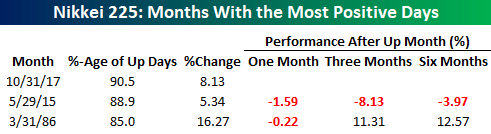
Since 1970, there have only been three months where the Nikkei traded higher on 85% or more of a month’s trading days, and the other two months were in May 2015 (88.9%) and March 1986 (85%). Each of those three months are highlighted in the chart below, and the performance of the Nikkei following the two prior months is summarized in the table below. The Nikkei’s performance following each of those prior two experiences couldn’t be more different. Back in 1986, the Nikkei was in the middle of an epic bull run that lasted another three years, while the occurrence in May 2015 was followed by a relatively steep decline and then a period of consolidation that continued right up until this month when the Nikkei finally made another multi-year high in mid-October.


Leave A Comment