
The equity market seems to know only one direction and that is up. The result of this type of pattern has been a downward trend in volatility with the VIX trading at a near single digit level. One characteristic of a low VIX reading and a higher trending market has been the absence of any significant equity market pullback. As Urban Carmel, author of The Fat Pitch blog notes,
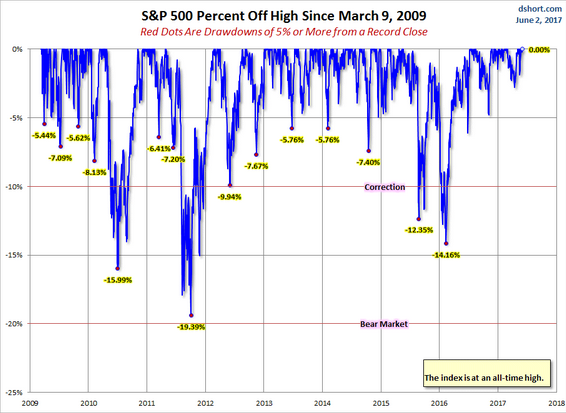
“SPX [S&P 500 Index] has now avoided a 5% drawdown since November 4, a period of 139 days. Since 2009, there have been only two uninterrupted uptrends that have lasted longer: 142 days (ending January 2014) and 158 days (ending September 2014). If past is prologue, then SPX appears likely to have a 5% correction before June 23 (158 days).”
I am not sure time in and of itself is a predictor of a 5% equity market correction, but the data is confirmation of the lower downside volatility recently experienced by the equity market as can be seen in the below chart.
Source: The Kirk Report
The seemingly uninterrupted move higher in the market has some concerned about the market’s valuation. One measure getting quite a bit of attention is the Shiller P/E with a recent value of 29.2 times and above the level reached in 2007. This is above the S&P 500 Index trailing P/E multiple of 21.6 times or the forward P/E multiple of 17.8 times. Another valuation measure is a P/E based on NIPA profits. This P/E is about 15 times and just slightly above its long term average.
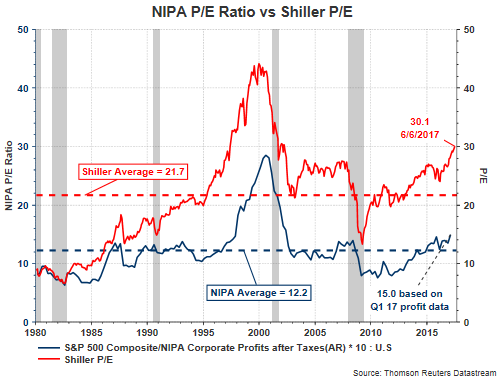
I discussed in a post late last year that stocks tend to trade at higher valuations in a lower inflation environment; however, there appears to be a sufficient number of P/E valuation measures to justify ones point of view on the market’s valuation, i.e., under valued, over valued or fairly valued. Even if one believes the market is overvalued, the market does not tend to correct simply because of a stretched valuation. Often some unforeseen catalyst triggers the market correction with valuation a factor in the significance of the prospective decline.


Leave A Comment