THE “STATE OF THE MARKETS”…
In an effort to make my weekly review of the state of the market models easier to digest, I am making some adjustments to the report.
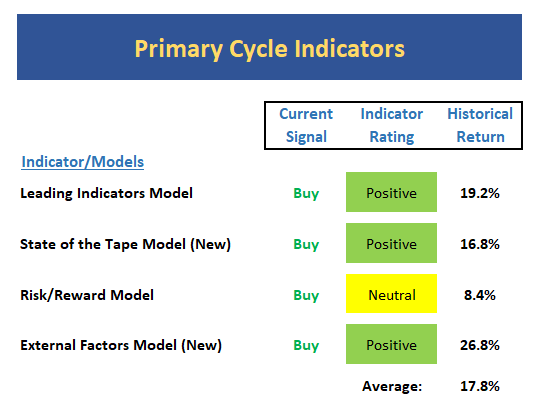
For those readers who like to stay on top of what the market “is doing,” but don’t enjoy digging into the guts of all the market models/indicators, I suggest a quick review of the Primary Cycle board. These models represent some (but not all – I’ll be upgrading the board in the coming weeks) of my favorite big-picture market models. As such, I’ve moved this indicator board – as well as this “executive summary” – up to the top of the report to make it easier to get the “bottom line.”
In looking at the Primary Cycle models this week, it is clear that there is a lot of green on the board and that the historical returns are strong. But (you knew that was coming, right?), I believe there are some “yea, buts” to consider this week. For example, the State of the Tape Model, while positive, has weakened a fair amount over the past two weeks (this despite a fresh all-time high for the S&P 500). And then the External Factors Model is currently sitting, quite literally, right on the line between positive and negative.
So, my take here is that while my market models/indicators are still in pretty good shape overall, I don’t see the “state of the market” being as positive as some of the boards might lead one to believe.
My Bottom Line: It’s a bull market until proven otherwise and the dips should continue to be bought. But, in my opinion, this is no time to have your foot to the floor.
THE STATE OF THE BIG-PICTURE MARKET MODELS
Let’s start with my “executive summary” of the state of the market – I.E. a review my favorite big-picture market models, which are designed to tell us which team is in control of the prevailing major trend.
Executive Summary:
The Leading Indicators model, which was our best performing timing model during the last cycle, popped back up into positive territory last week. In short, I breathe easier when this model is positive.
We have recently upgraded our “State of the tape” model to include an additional 5 indicator readings. The current reading of the new model is has slipped to moderately positive. While not a reason to get defensive, this is indeed something to keep an eye on in the coming weeks/months.
The Risk/Reward model continues to wrestle with negative sentiment readings and the weakening monetary environment. As such, the model is stuck in neutral.
The newly expanded External Factors model includes a total of 10 indicators ranging from earnings, yields, sentiment, monetary, economic, and volatility. The current model reading is technically positive, but is currently sitting, quite literally, on the line. So, this too is something to watch.
THE STATE OF THE TREND
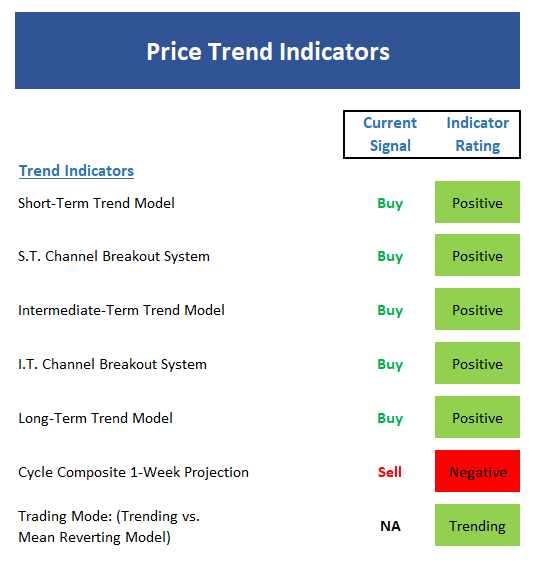
Digging into the details, I like to start my weekly review with a look at the “state of the trend.” These indicators are designed to give us a feel for the overall health of the current short- and intermediate-term trend models.
Executive Summary:
The short-term Trend Model starts the week in positive territory, but only by a modest margin. While this may sound odd with the S&P finishing at a fresh all-time high on Friday, there is resistance overhead from a short-term perspective and only modest support.
Both the short- and intermediate-term Channel Breakout Systems remain positive and on buy signals.
The intermediate-term Trend Model starts the week positive once again.
The long-term Trend Model hasn’t budged and continues to sport a bright shade of green at this time.
The Cycle Composite points to sloppy action over the next two weeks.
The Trading Mode models continue to suggest the market is trending.
The recent sloppy action in the market was to be expected and the blue chip indices remain in good shape. However, the semiconductors bear watching in the near-term.
THE STATE OF INTERNAL MOMENTUM
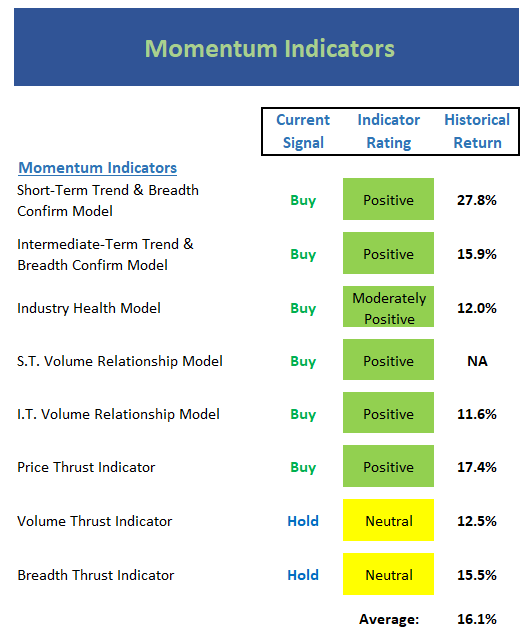
Next up are the momentum indicators, which are designed to tell us whether there is any “oomph” behind the current trend.
Executive Summary:
The short-term Trend and Breadth Confirm Model has flip-flopped between positive and neutral several times over the past two weeks – but is positive to start the week here.
Our intermediate-term Trend and Breadth Confirm Model has been a very strong indicator of the overall trend and remains positive.
The Industry Health Model continues to waffle in moderately positive territory and refuses to break into on outright bullish mode.
The short-term Volume Relationship is positive to start the week, but only modestly so. I’ll be watching this situation closely for signs of a breakdown in market internals.
The intermediate-term Volume Relationship remains in pretty good shape. My only complaint here is that Demand Volume peaked in March and remains well below the highs. A technical breakdown here would be worrisome.
Since the Price Thrust Indicator is an oscillator, it is not surprising to see the model reading backing off here – but still positive.
The Volume Thrust Indicator remains neutral this week.
The Breadth Thrust Indicator also slipped back to neutral this week. However, note that the historical return of the market when in this mode is well above average.
In sum, market momentum is in decent shape. But I do see some weakness creeping in.


Leave A Comment