The New Zealand dollar dropped under the weight of the greenback and settled in a lower range. Trade balance and the annual budget release are this week’s events. Here is an analysis of fundamentals and an updated technical analysis for NZD/USD.
There were quite a few releases in New Zealand in the past week, but they basically balanced each other. Inflation expectations remained unchanged at 1.6%, milk prices advanced by 2.6% but PPI Input fell by 1%. On the other side of the Pacific, the Fed’s meeting minutes were hawkish boosting the US dollar on higher expectations for a rate hike in June.
Updates:
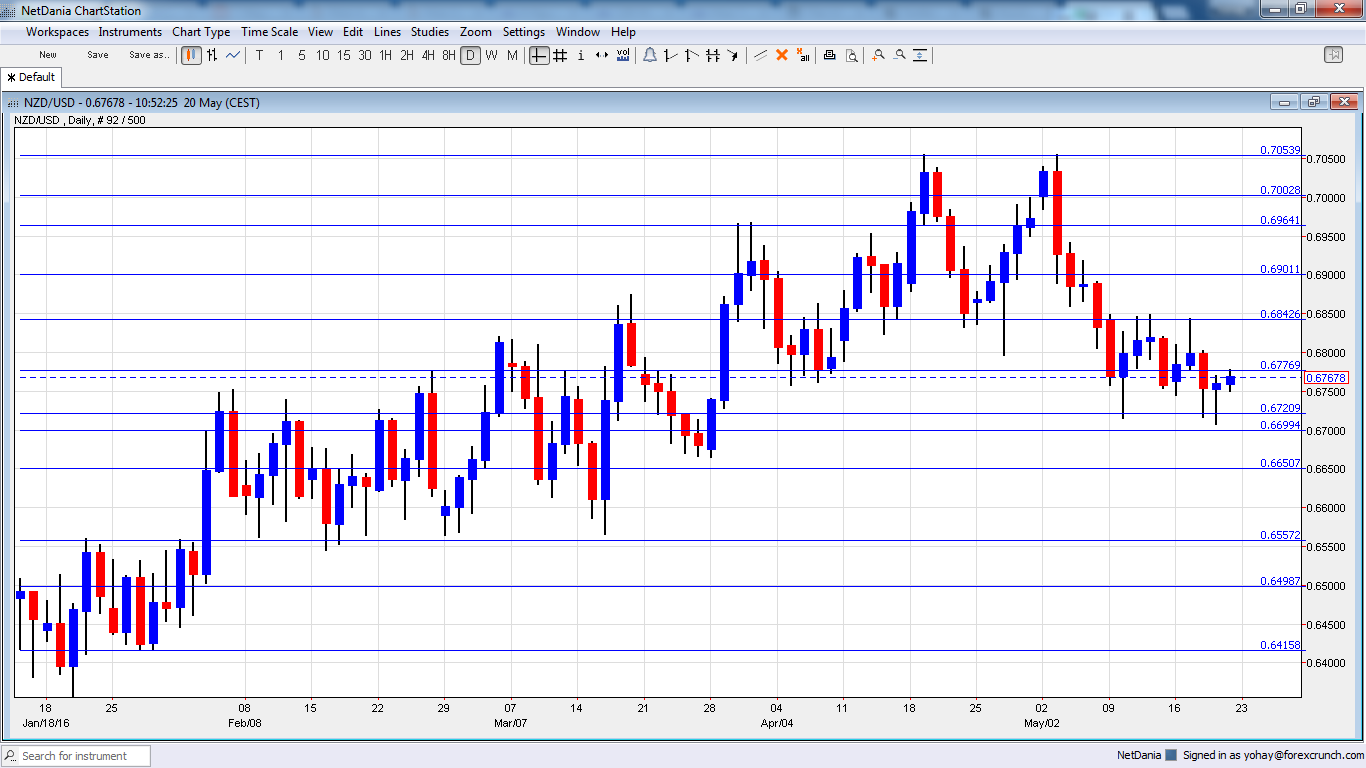
NZD/USD daily graph with support and resistance lines on it.

NZD/USD Technical Analysis
Kiwi/dollar dropped lower and established itself between 0.6720 to 0.6840.
Technical lines, from top to bottom:
0.7160 worked as support when the kiwi was trading on much higher ground in 2014. 0.7050 was the high in April 2015.
The round level of 0.70 is still important because of its roundness but it isn’t really strong. The low of 0.6940 allowed for a temporary bounce.
The round 0.69 level has switched positions to resistance. 0.6840 capped the pair during May 2016 and tops the range. 0.6720 is the low seen in May 2016 more than once providing the lower bound.
The round level of 0.67 that works nicely as support. Another line worth noting is 0.6640, which capped the pair in November.


Leave A Comment