This post is a review of all major leading indicators follows – and their trends are generally indicating stronger growth.
Analyst Opinion of the Leading Indicator Forecasts
Most of the leading indicators are based on factors which are known to have significant backward revisions – and one cannot take any of their trends to the bank. The only indicators with minimal backward revision are ECRI, RecessionALERT, and the Chemical Activity Barometer. Unfortunately, the Chemical Activity Barometer is targeted to the industrial sector of the economy – and at best seems to be a coincident indicator, not a leading indicator.
The leading indicators are to a large extent monetary based. Econintersect does not use any portion of the leading indicators in its economic index. Most leading indices in this post look ahead six months – and are all subject to backward revision.
At this point, Econintersect sees NO particular dynamic at this time which will deliver noticeably better growth in the foreseeable future – and the majority of the indicators are forecasting a slower rate of growth.
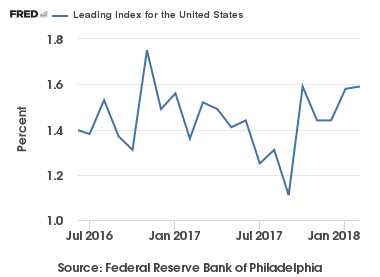
Philly Fed Leading Index
The Philly Fed Leading Index for the United States is continuously recalculated. Note that this index is not accurate in real time as it is subject to backward revision, Per the Philly Fed:
The Federal Reserve Bank of Philadelphia has released the leading indexes for the 50 states for October 2017. The indexes are a six-month forecast of the state coincident indexes (also released by the Bank). Forty-six state coincident indexes are projected to grow over the next six months, and four are projected to decrease. For comparison purposes, the Philadelphia Fed has also developed a similar leading index for its U.S. coincident index, which is projected to grow 1.7 percent over the next six months.
[click on graphic to enlarge]

z philly fed leading.PNG
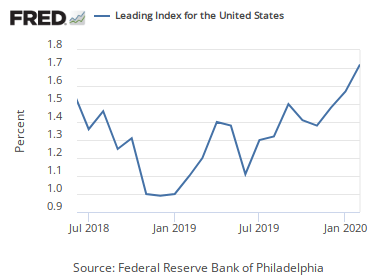
Index Values Over the Last 12 Months


Leave A Comment