

Well, I just can’t resist the “freeze” nonsense emanating from rumormongers and trading algos to squeeze shorts once again.
It must be the 6th or 7th time this lame nonsense has hit the tape.
Sure, today the rig count dropped to near record lows. This should raise prices once again, but once again it’s the boy that cried wolf.
A quick inspection shown below is a current satellite photo of 30 supertankers lined up near Basra, Iraq, featuring the tsunami of oil ready to hit the markets.
It ain’t freezing there.

I promised myself a day off Friday and dammit, I’m going to stay with my pledge.
Below is the heat map from Finviz reflecting those ETF market sectors moving higher (green) and falling (red). Dependent on the day (green) may mean leveraged inverse or leveraged short (red).

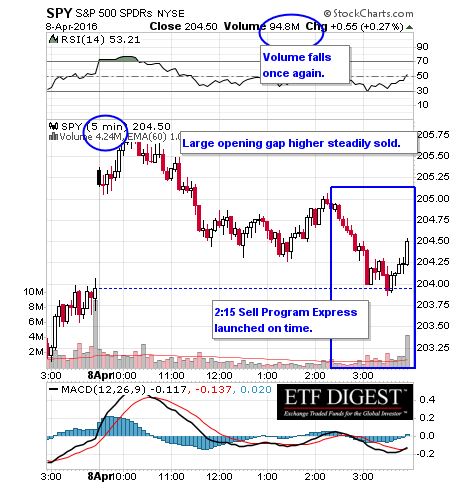
Volume was right and breadth per the WSJ was mixed.


Charts of the Day
SPX 5-Minute
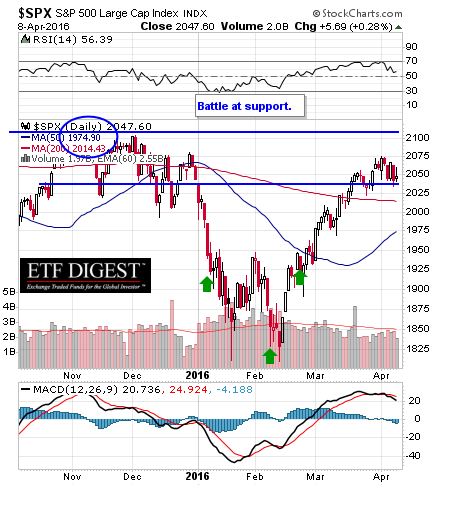
SPX Daily
SPX Weekly

Okay, I’m done for the day beyond what I promised myself. (sigh)
Let’s see what happens.


Leave A Comment