The U$ has slumped on increasing Trump lumps the past month–no health care rewrite, no imminent tax code overhaul, and that debt ceiling is back. This has spurred some strength in the price of crude and its handmaiden the Canadian dollar. It seems likely that both of these short-term rebounds are overdone.
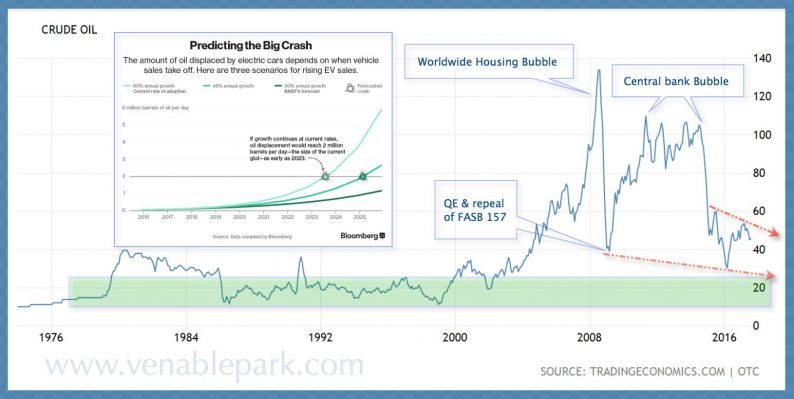
As shown here, crude prices traded in a long term channel between $10 and $38 a barrel from the late 1970’s into the early-2000’s, when China joined the World Trade Organization and bankers spread their magical debt securitization model from the smoking remains of Enron and Worldcom in 2001, to companies and economies all around the world. This enabled the build of toxic debt that fueled the western consumption bubble and China growth explosion into 2007, before it all imploded in 2008, prompting the Central Bank liquidity mayhem we have seen bubbling up in assets and related services since. But as central banks began their efforts to back out of unsustainable measures since 2015, the price of crude responded with a trip back to the $40’s even as OPEC has cut output and talked up their hoped for needed Aramco IPO. The historical norm of a $10-20 a barrel range (green band below) continues to beckon.

The same Fed-induced liquidity that has billowed asset bubbles and unduly enriched bankers the past decade, has also inadvertently helped to fuel a transportation and energy tech revolution which has moved from near zero to 60 to the shock of the ICE (Internal combustion engine) industry.
As shown in the box above, the current pace of EV (electric vehicle) adoption is moving at an annualized growth rate of 60%. At this pace, EV’s alone (not to mention all the other energy and increased efficiency innovations across a multitude of key sectors) are on track to displace 2 million barrels a day of world oil demand within 5 years.It could well happen faster, as Moore’s Law continues to surprise and week after week car companies scramble to catch the EV wave.


Leave A Comment