
Oil prices are rallying for a second consecutive day after the weekly US Crude data pointed to a drawdown in stockpiles. The recent drop was unexpected, although traders were already positioned for a draw in recent days with markets asking questions on how long the US could keep up this pace of pumping up Oil. It looks like OPEC and the US are playing a game of chicken to see who will be the first one to lose: the US by seeing its stockpile decline substantially, or will it be OPEC forced to apply more, longer, and deeper production cuts?The US Dollar, meanwhile, is trading in the green ahead of this Thursday’s data release. With the weekly unemployment numbers, US Retail Sales and Producer Price data all being released at the same time, a spur of volatility could be upon us. Crude Oil (WTI) trades at $80.10 per barrel, and Brent Oil trades at $84.30 per barrel at the time of writing. Oil news and market movers: US stockpile slinks
Oil Technical Analysis: Golden Cross nearbyOil prices could be entering a broad uptrend when it comes to a purely technical angle. The 55-day Simple Moving Average (SMA) at $75.61 is crossing the 100-day SMA at $75.57. Once both elements are starting to head higher, Oil prices should see more inflow with more bullish bets being placed in the option space, widening the spread between puts and calls, and thus creating volatility which could see Crude sprint to $89.64 by summer. Oil bulls still clearly see more upside potential seeing the spreads on Oil futures in favor. The break above $80 needs to see a daily close in order to confirm a change in sentiment. Next up is the $86 level. Further up, $86.90 follows suit before targeting $89.64 and $93.98 as top levels. On the downside, the 100-day and the 55-day Simple Moving Averages (SMA) are near $75.57 and $75.61, respectively. Add the pivotal level near $75.27, and it looks like the downside is very limited and well-equipped to resist the selling pressure. 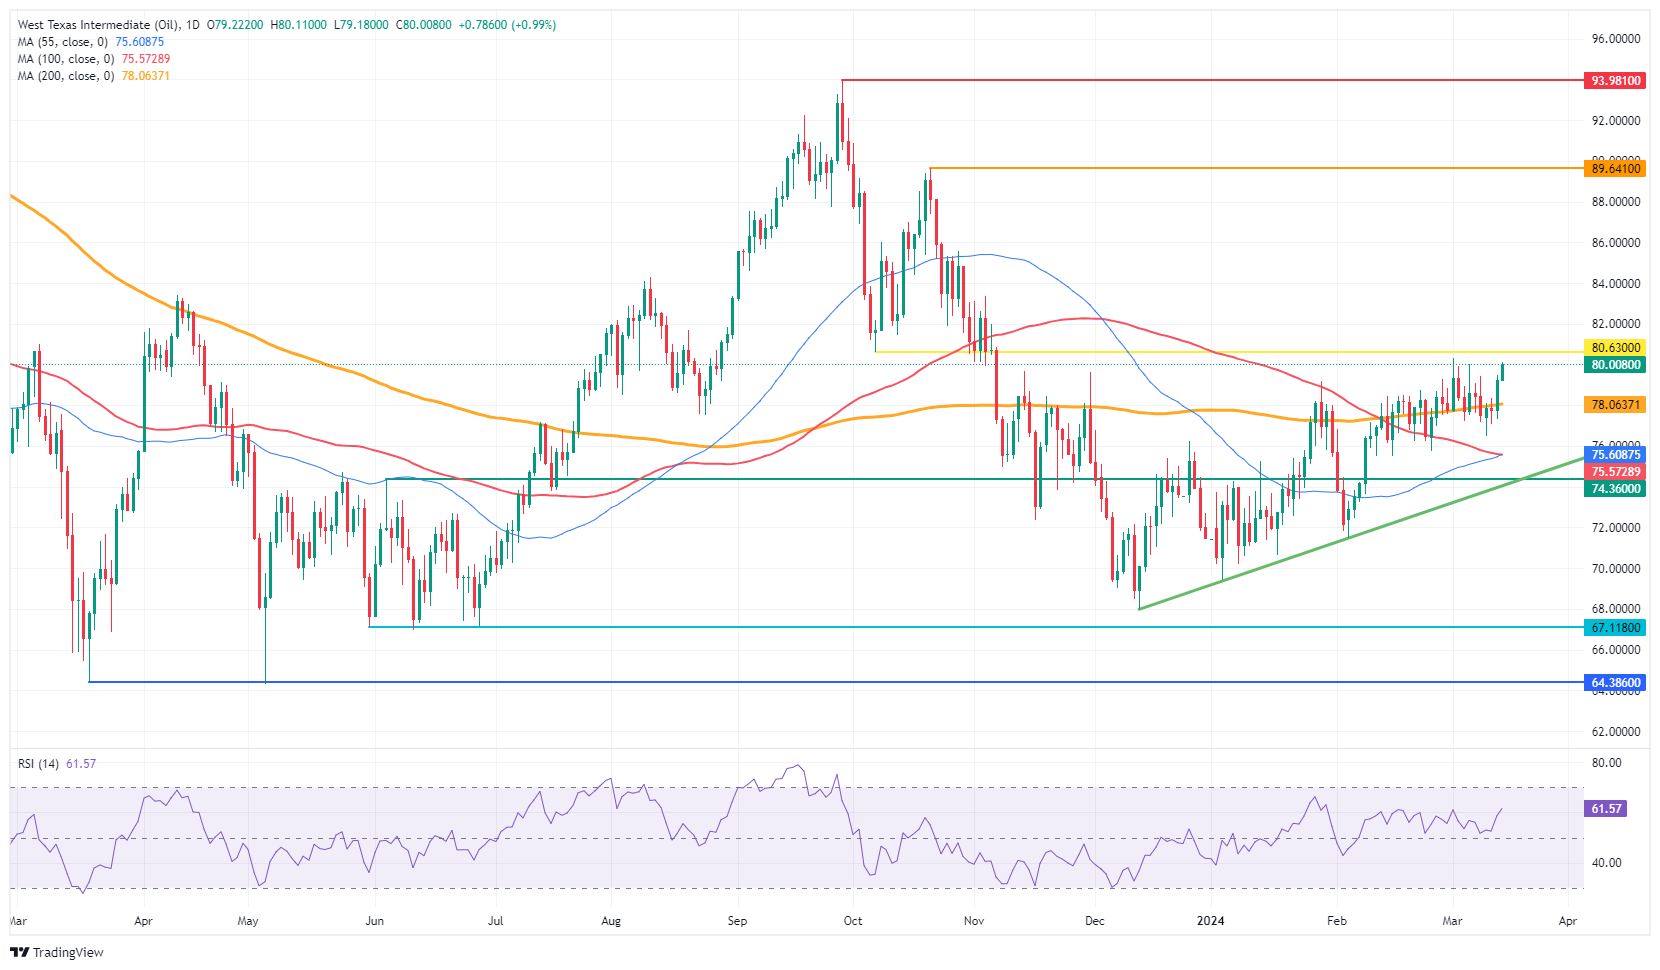 US WTI Crude Oil: Daily ChartMore By This Author:Oil Back In The Red Ahead Of US Nonfarm Payrolls US Dollar Retreats As Traders Brace For PCE Inflation Data


Leave A Comment