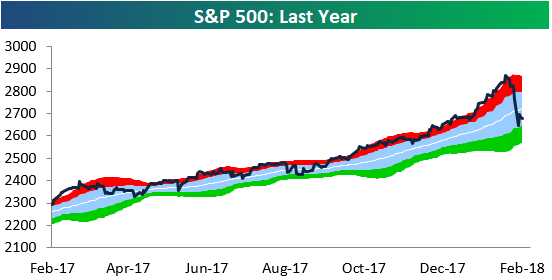
Below is a quick snapshot of the S&P 500 run through our trading range chart. After trading overbought for four consecutive months and then going parabolic in January, the S&P has been re-introduced to the concept of “mean reversion.”

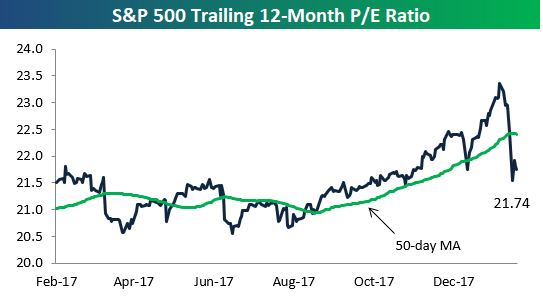
One benefit of the mean reversion is that valuations have fallen quite dramatically in the span of a week. As shown below, the S&P 500’s trailing 12-month P/E ratio had stretched above 23 at the end of January, but it now sits below 22 at 21.74. As long as earnings (the “E” in P/E) remain strong, any price decline in the S&P will cause the P/E ratio to drop.


Leave A Comment