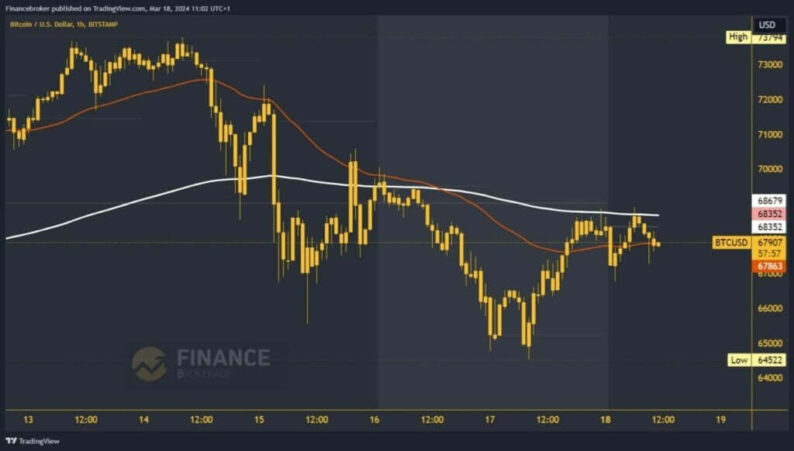
Bitcoin chart analysisOver the weekend, Bitcoin’s price remained under pressure below the EMA200 moving average. On Saturday morning, we tried to test and move above $70000 but failed to do so. A bearish consolidation followed, dropping the price below the $67,500 level. The price also broke through that support level and continued until the end of the day to the $64775 level.The price recovered to the $66,500 level on Sunday morning. In that first attempt, we stopped and encountered resistance. This led to a bearish impulse and a drop to the weekly low at the $64522 level. With the new support, we started a new recovery and successfully returned above the $68000 level by the end of the day.  Does Bitcoin have the strength to bounce back above $70,000?In that zone, the new pressure of EMA200 does not allow us to move above it, and at the start of Monday, the price fell to the $67,000 level. This morning, the price consolidated positively, and bitcoin jumped to the $68900 level. Again, we failed to hold above the EMA200, which is already slowly starting to put more pressure on the price.Based on this, we could see a new bearish impulse and a drop to a new daily low. Potential lower targets are the $66500 and $66000 levels. For a bullish option, we need to move again above the EMA200 and the $68800 level. Then, we also need to maintain ourselves there above. After forming a bottom at that level, we will have the opportunity to start a bullish scenario with positive consolidation. Potential higher targets are the $70000 and $70500 levels.More By This Author:Oil And Natural Gas: Oil Searches For Support At $81.00 BofA Cuts Adobe Target To $640, Bullish On AI Future Tesla Eyes Dogecoin Payments: A 2024 Vision


Leave A Comment