
The stock market has been tumbling lately, which means that dramatic media headlines are roiling investor sentiment far and wide. As a result, recency bias threatens to overwhelm otherwise rational mind. To be fair, October looks pretty grim and the latest market rout could roll on… or not. But before you let your emotional demons take over all your decisions, take a moment to consider the historical perspective, which tends to be overlooked in times like these.
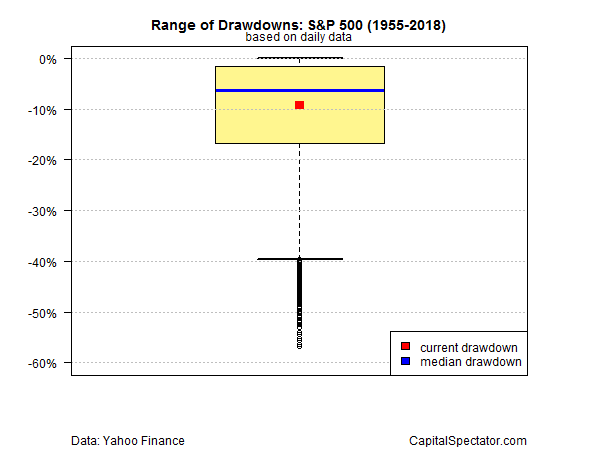
Consider, for example, how the world’s most popular benchmark for US stocks — the S&P 500 – stacks up via several measures that attempt to put the latest slide into broader context. Let’s start with drawdown. The current peak-to-trough decline is 9.4%, based on data through yesterday’s close (Oct. 24). That may sound like a hefty haircut, particularly if you were counting your profits when the market reached an all-time peak last month. But as the past 60-plus years remind, a ~9% drawdown for the S&P is about as unusual as sand in the Sahara.
As the boxplot below reminds, the current drawdown is extraordinarily ordinary, as indicated by the red box that’s more or less in the middle of the interquartile range (yellow box) of drawdown results since 1955. In other words, the peak-to-trough decline through yesterday is close to “normal”.
Let’s turn to returns. If you’ve been reading the breathless reporting by the usual suspects, the latest market slide harbors great drama. But filtering the data through a one-year-return lens takes some of excitement out of the analysis. The S&P is up 3.4% over the past year via a 252-trading-day window (before factoring in distributions, which is the standard throughout this post). Yes, that’s well below the 9.7% median return since 1955, but the S&P’s rolling one-year performance is a volatile beast and so it’s not unusual for this historical return measure to bounce around by more than a trivial degree. In any case, as the next boxplot below shows, the current one-year return is far from unusual, as indicated by the latest data point that’s still comfortably inside the interquartile range of historical results.


Leave A Comment