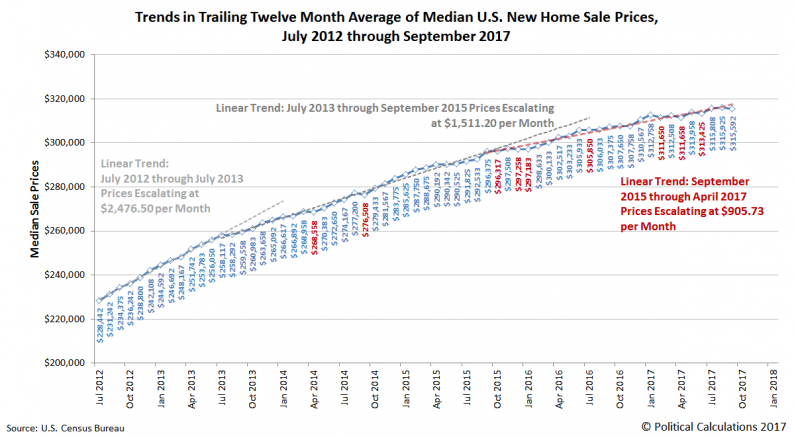
There have been three main trends in median new home sale prices since July 2012. The following chart updates where we are through September 2017.
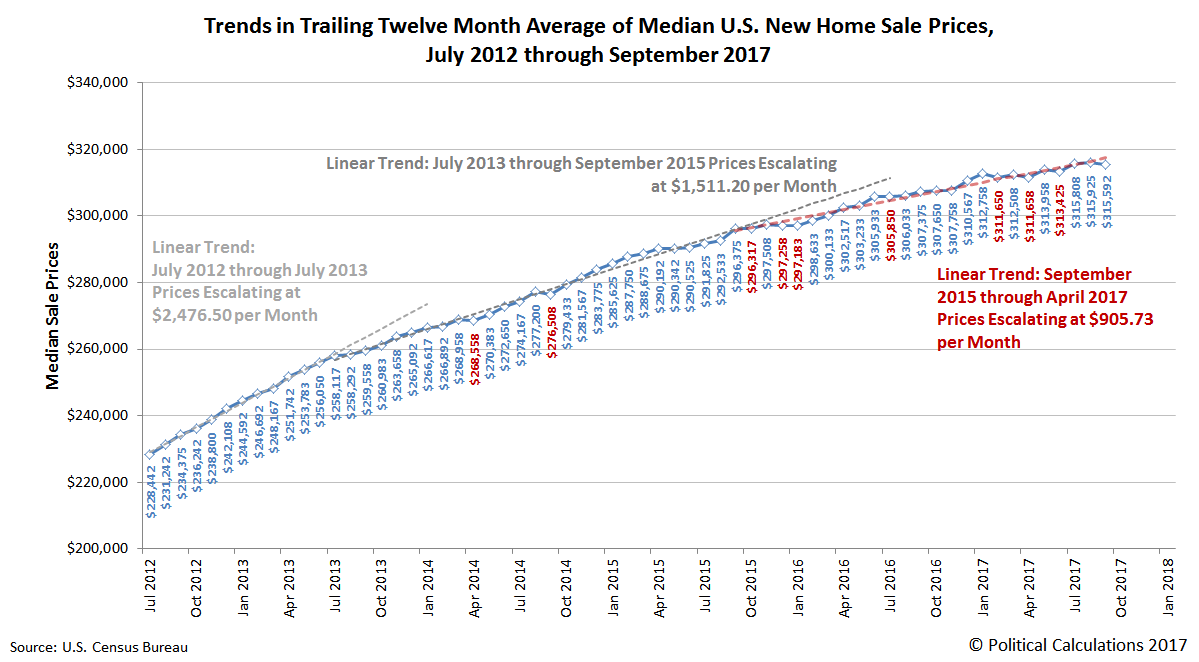
For the most recent trend, which began two years ago in September 2015, the trailing twelve month average of median new home sale prices in the U.S. has been escalating at an average rate of $906 per month.
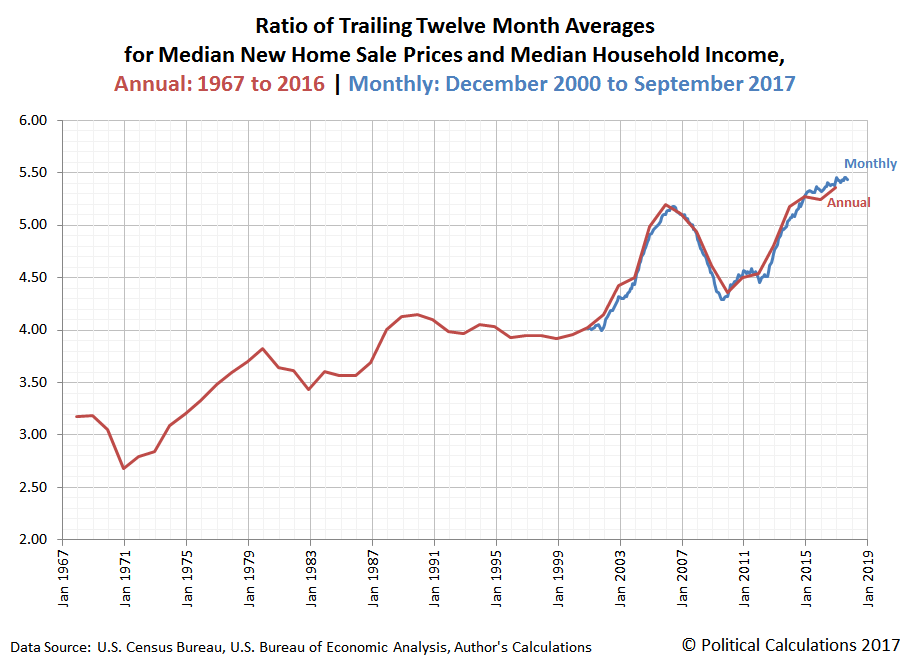
In terms of affordability, the ratio of the trailing twelve-month averages of median new home sale prices to median household income in the U.S. is near its all-time high of 5.454, which following revisions in the data for new home sale prices, was recorded in July 2017. The initial value for September 2017 is 5.437.
Our final chart updates the relationship between U.S. median new home sale prices and median household income, with the annual data now spanning 2000 through 2016 and the monthly data covering the period from December 2000 through September 2017.
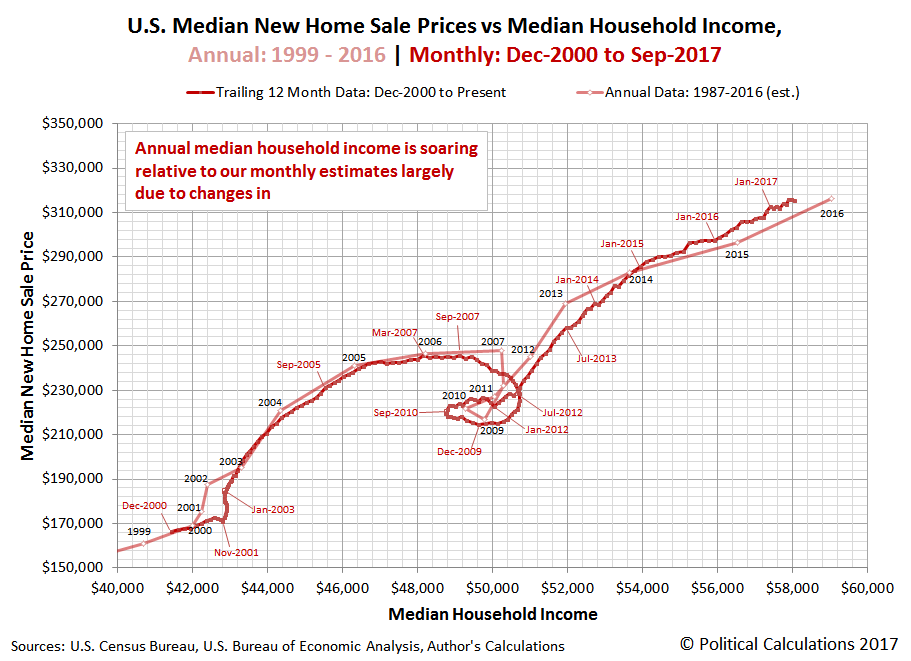
The annual data is based solely on the U.S. Census Bureau’s annual new home sale price and household income data, while the monthly data is based on the U.S. Census Bureau’s monthly new home sale price data and our preliminary estimates of monthly household income in the United States.
Data Sources
U.S. Census Bureau. Median and Average Sales Prices of New Homes Sold in the United States. [PDF Document]. Accessed 26 October.
U.S. Bureau of Economic Analysis. Table 2.6. Personal Income and Its Disposition, Monthly, Personal Income and Outlays, Not Seasonally Adjusted, Monthly, Middle of Month. Population. [Online Database (via Federal Reserve Economic Data)]. Last Updated: 1 October 2017. Accessed: 5 October 2017.
U.S. Bureau of Economic Analysis. Table 2.6. Personal Income and Its Disposition, Monthly, Personal Income and Outlays, Not Seasonally Adjusted, Monthly, Middle of Month. Compensation of Employees, Received: Wage and Salary Disbursements. [Online Database (via Federal Reserve Economic Data)]. Last Updated: 1 October 2017. Accessed: 1 October 2017.


Leave A Comment