Record High Small Business Optimism
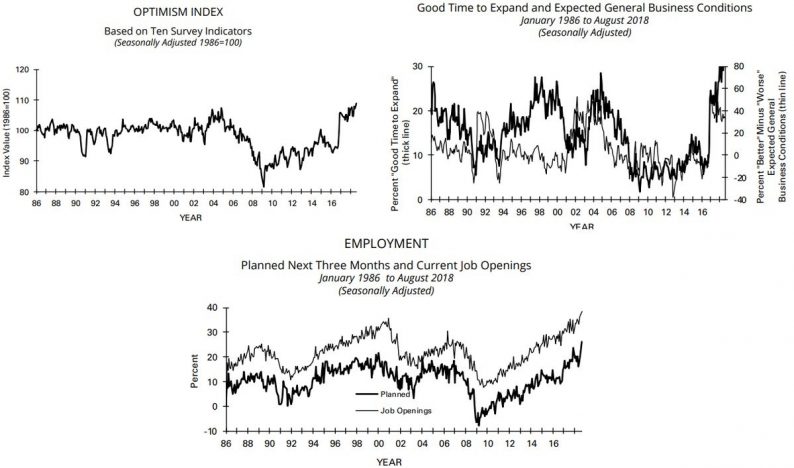
The NFIB small business optimism index was up from 107.9 in July to 108.8 in August. It beat the consensus for 108.1 and the high end of the range which was 108.5. This was the highest reading in the 45-year history of the report. You can see in the first chart below that the index spiked after the 2016 election and has increased since then. Firms love the tax cuts, regulation cuts, and the strong dollar. There has been about 2 years of euphoria in this index which has translated into solid economic growth, strong consumer spending growth, and appreciation in the stock market.
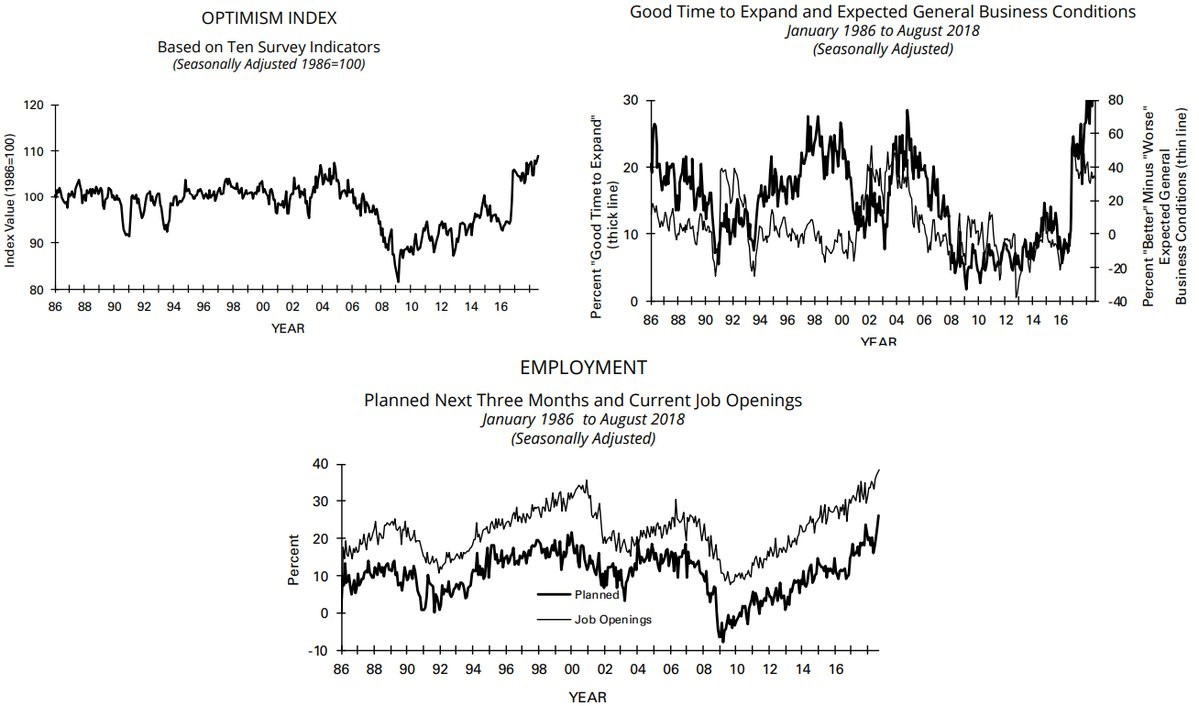
As you can see from the second chart above, firms think now is a great time to expand because the economy is strong. The net percentage of small businesses who said now is a good time to expand increased 2 points to 34%. The bottom chart above shows the planned hiring and job openings indexes also increased. The net businesses reporting job openings they could not fill increased 1% to 38% which is a record high. This looks just like the JOLTS report which I will review later. Both of those reports are different from the prime age labor force participation rate which signals there is still slack in the labor market.

As you can see from the chart above, the net percentage of firms planning capital expenditures in the next 3 to 6 months was up 3 points to 33. This is the highest reading since 2007. As you can see, it still has room to increase a few points as it hit 40% in the 1990s. If this cycle reaches the height of the 1990s, it will probably last 1-2 more years. Some look at the 2000s cycle and the 1990s cycle as equally likely to occur because they were the two most recent ones. However, since there isn’t a bubble in the largest asset consumers own and oil isn’t at $147, I think it’s fair to ignore the last cycle. That’s probably an obvious assumption at this point since this expansion has been much longer than the 2000s expansion and growth in consumer spending has come without excess leverage. The household debt to GDP ratio has actually fallen by about 30%.


Leave A Comment