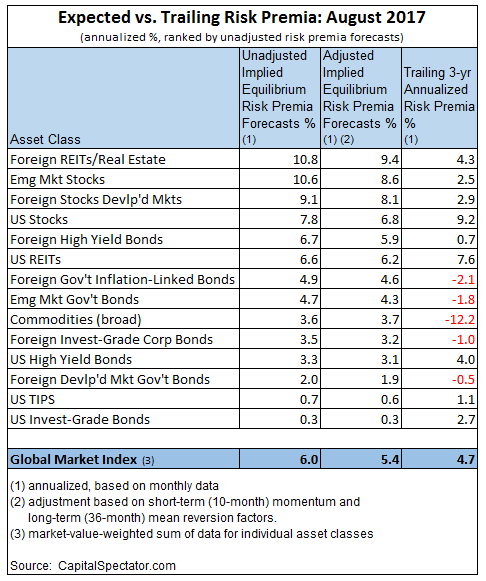
The expected risk premium for the Global Market Index (GMI) continued to rise in August. GMI, an unmanaged, market-value weighted portfolio of the major asset classes, is currently projected to earn an annualized 6.0% (over the “risk-free” rate) in the long run. The estimate is 20 basis points above last month’s forecast.
Adjusting for short-term momentum and longer-term mean-reversion factors (defined below) cuts GMI’s ex ante risk premium to an annualized 5.4%, although this estimate also edged up in August.
Meanwhile, the historical risk premium for GMI ticked down last month. The three-year annualized total return for the benchmark through August slipped to 4.7%, down from 5.2% in the previous month, based on month-end data.

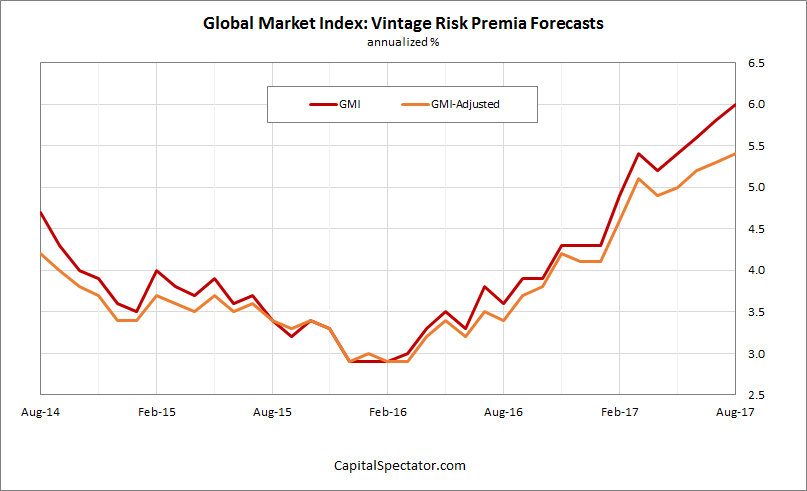
Here’s a recap of how GMI’s risk premium estimates have evolved over the last three years:
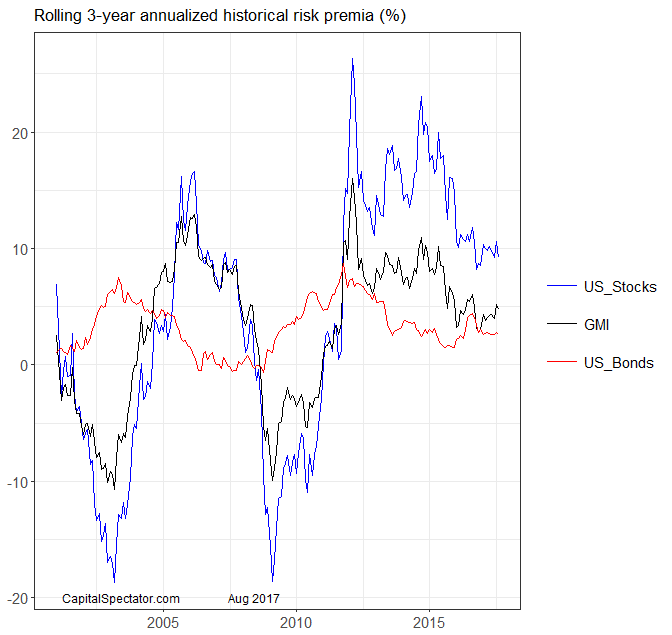
For some historical context on what the market delivered, here’s a chart of rolling three-year annualized risk premia for GMI, US stocks (Russell 3000), and US Bonds (Bloomberg Barclays Aggregate Bond Index) through last month.
Finally, here’s a summary of the methodology and rationale for the estimates above. The basic idea is to reverse engineer expected return based on assumptions about risk. Rather than trying to predict return directly, this approach relies on the somewhat more reliable model of using risk metrics to estimate performance of asset classes. The process is relatively robust in the sense that forecasting risk is slightly easier than projecting return. With the necessary data in hand, we can estimate the implied risk premia using the following inputs:
? an estimate of GMI’s expected market price of risk, defined as the Sharpe ratio, which is the ratio of risk premia to volatility (standard deviation).
? the expected volatility (standard deviation) of each asset
? the expected correlation for each asset with the overall portfolio (GMI)


Leave A Comment