As you know, at 360 Investment Research, we’re big proponents of price. Price is the manifestation of opinion and final arbiter of value. When we visualize price on a chart, all we need to do is look left to identify important characteristics of the security we’re observing. We like to look for evidence to support our investment decisions. The best and most important piece of evidence is price. What is it doing? What’s its direction? If price is making higher highs and higher lows, the trend is up. If price is making lower highs and lower lows, the trend is down. By analyzing price itself, we can determine the general trend and the potential change thereof.
When observing a popular U.S. equity market, such as the S&P 500, we can grasp the current state of that market by looking at its price action. To summarize what we’re seeing currently, the price behavior of the S&P 500 indicates there is no reason to own U.S. equities (as a whole) right now.
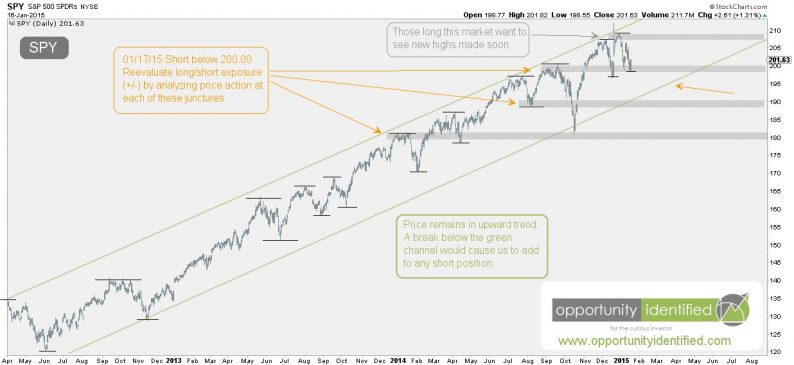
Using the ETF SPY as our proxy for the S&P 500, you can see that our concerns dating back to 01/17/15 were warranted. Here is the chart of SPY we shared on that day back in January:
Click on picture to enlarge

And, here is the same chart updated through today’s prices:
Click on picture to enlarge
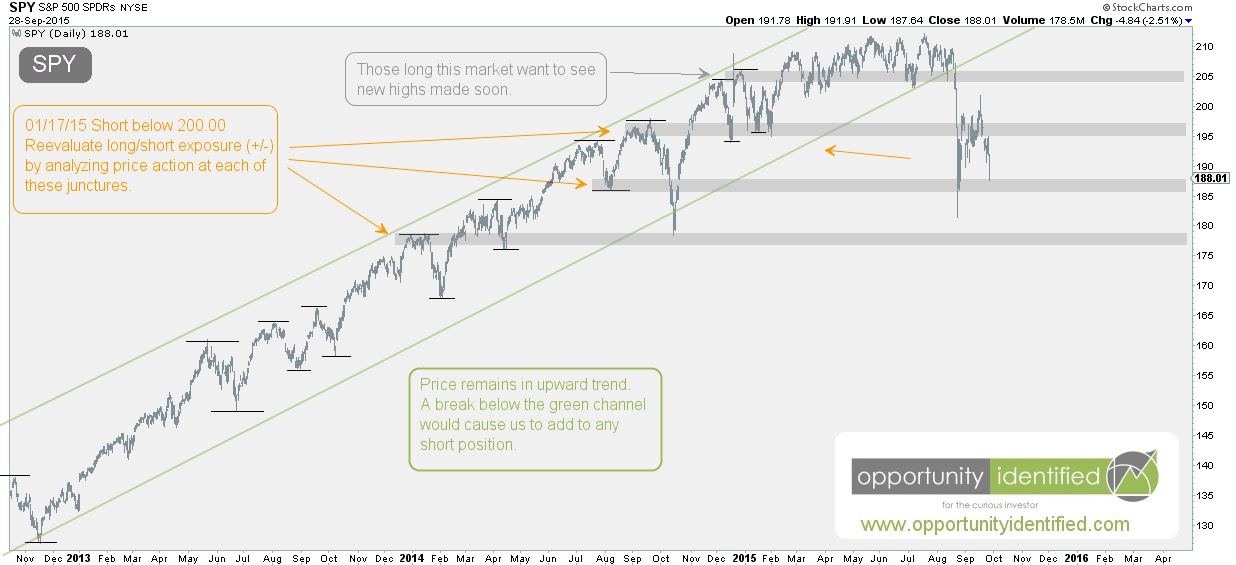
As you can clearly see, price moved to new highs in early February, but could not hold them. The lower green trendline proved to be a significant resistance point, that when broken, brought in new supply (aka selling). Accordingly, a new lower low was established, indicating a major change in trend could be upon us. Subsequently, we noticed a new lower high recently, where sellers stepped in near the 200.00 level, causing the price to fall again. Bringing us to today. See the re-annotated chart below:
Click on picture to enlarge
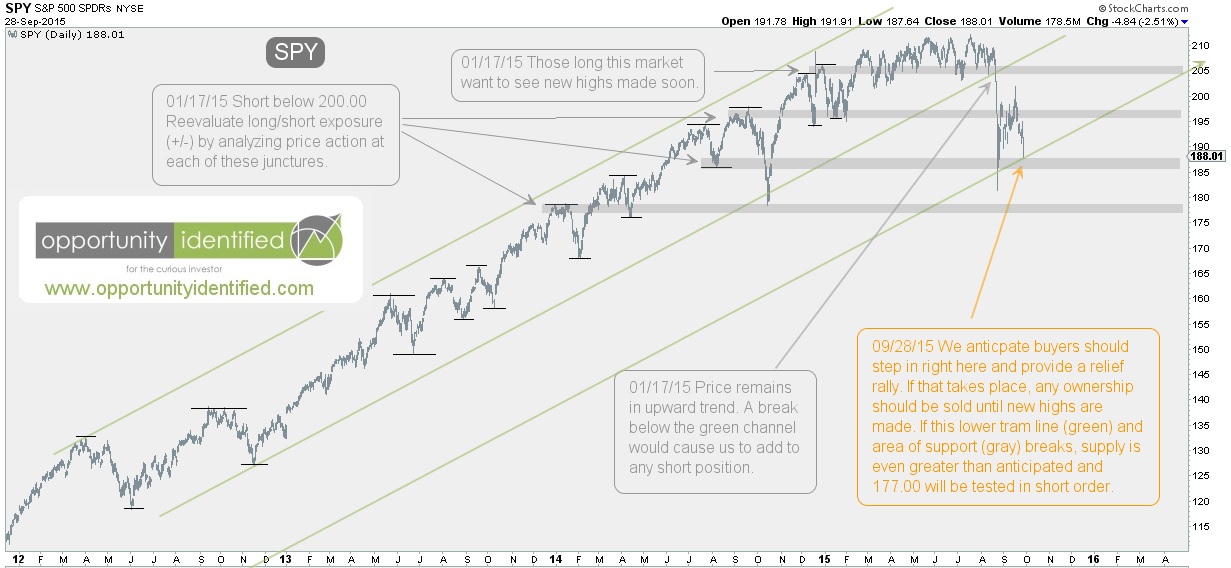
As a reminder, in an uptrending market, we want to see higher highs and higher lows. As of right now, a new lower low and lower high have been established. If buyers do not step in at this junction, price will fall rapidly again to find demand. Though it is possible that a rip-your-face-off rally could take place from this price point, we want nothing to do with this (as a long trade) until new highs are established (a close above 212.00). Each gray area indicates where previous demand, now turned to supply, will be at its greatest. And if the lower green tramline (aka parallel line equidistant from previous trendlines) breaks, the next area of support / demand near 177.00 will be tested.


Leave A Comment