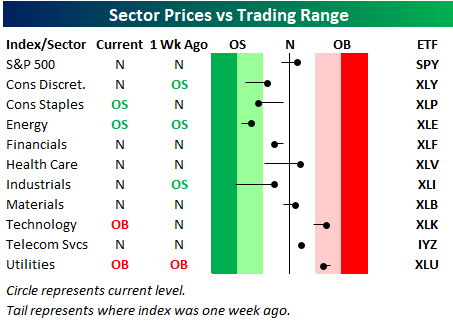
As shown in our sector trading range screen below, the S&P 500 has re-taken its 50-day moving average as we get set to begin the last trading day of August. (For reference, the black, vertical “N” line represents each sector’s 50-day moving average. The dot represents where each sector is currently trading, while the tail end represents where it was trading one week ago.)
While the S&P is back above its 50-day, some key cyclical sectors remain below their 50-days. These include Consumer Discretionary, Energy, Financials, and Industrials. Fortunately, both Health Care and Technology — the two largest sectors — are solidly back above their 50-days

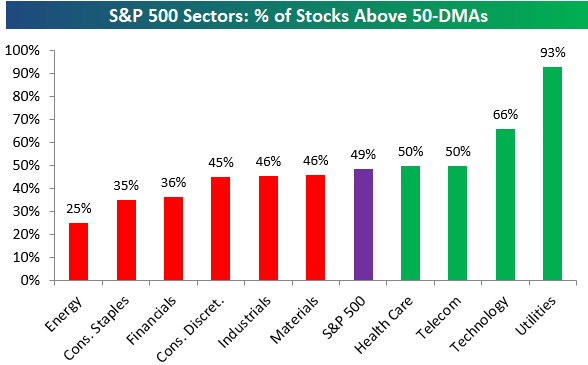
Below is an updated snapshot of a key breadth measure we track — the percentage of stocks trading above their 50-day moving averages. While the S&P 500 is back above its 50-day moving average on a price basis, as shown below, less than 50% of the stocks in the index are trading above their 50-days. This is a slightly negative breadth divergence.
The most defensive sector of the market — Utilities — currently has the strongest breadth, while Technology ranks second at 66%. If it weren’t for Tech’s massive outperformance this year, the market would be in a much different — darker — place.
On the downside, Energy has the weakest breadth with just 25% of stocks above their 50-days. The Financial sector remains weak as well at 36%.
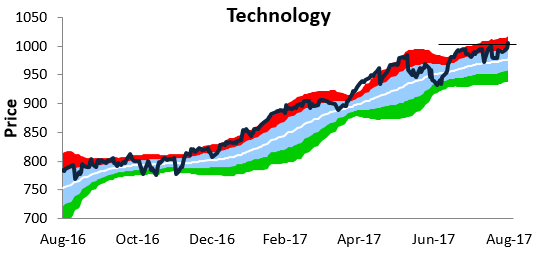
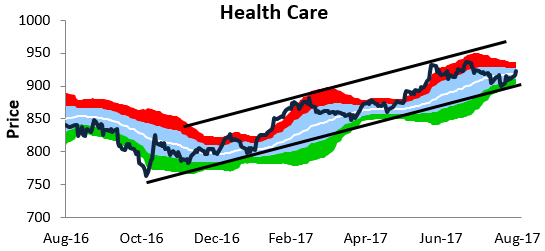
As mentioned above, both Tech and Health Care are trading back above their 50-day moving averages. These two sectors currently have the most attractive chart patterns in our view. Tech is in the midst of another breakout, while Health Care is swinging higher within a long-term uptrend channel.
On another note, Tech’s weighting in the S&P 500 is now all the way up to 23.5%, while Health Care has just moved into second place with a weighting of 14.5%. The Financial sector has slipped into third with a weighting of 14.3%.


Leave A Comment