US stocks are trying to stabilize after a decent drawdown. How things evolve will depend a lot on how margin debt, money-market fund assets and foreigners’ purchases evolve in the weeks/months to come.

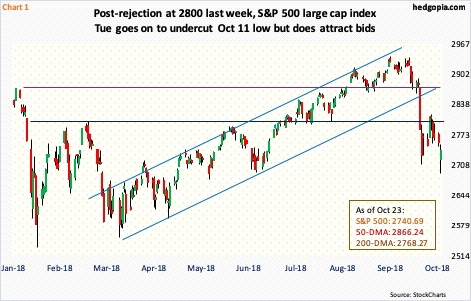
After a seven-session, 7.8-percent decline intraday between the 3rd and 11th this month, the S&P 500 large cap index (2740.69) continues to try to stabilize. Tuesday, the intraday low of 2710.51 nine sessions ago was breached as the index fell all the way to 2691.43 but the intraday swoosh down was used as an opportunity to buy (Chart 1).
Tuesday’s low also tagged the daily lower Bollinger band. The daily chart is extremely oversold. Odds continue to favor a relief rally. Last week, rally attempts were denied at horizontal resistance at 2800. This also represents the underside of a broken trend line from February 2016. Before this, the 200-day moving average lies at 2768.27.
October-to-date, the index is down six percent. This follows a very good August (up three percent) and decent September (up 0.4 percent). Year-to-date, the S&P 500 is now only up 2.5 percent – was up as much as 10 percent at its peak of 2940.91 reached on September 21.
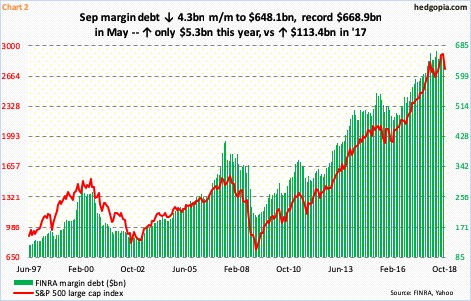
The performance this year pales in comparison to last year’s, when the S&P 500 jumped 19.4 percent. In 2017, margin debt fully cooperated. FINRA margin debt went from $529.4 billion to $642.8 billion – up a huge $113.4 billion. In the first nine months this year, margin debt is only up $5.3 billion. The two tend to move in unison (Chart 2).
In September, margin debt fell $4.3 billion to $648.1 billion. It peaked in May this year at $668.9 billion, nearly flattish to January’s $665.7 billion. The S&P 500 made an important high in that month before quickly dropping 10-plus percent. Stocks have gotten addicted to margin debt, and need this what is now a mild headwind to turn into a tailwind for a sustained move higher.

Interestingly, at least until Wednesday last week, another potential source of tailwind continued to play cautious. The S&P 500 made that initial low on the 11th (Chart 1). In the week ended October 10, US money-market fund assets were $2.89 trillion. This was the highest since April 2010. In the following week, these assets fell a tad to $2.87 trillion. This week’s data will be published later today, and can be telling as to how things might evolve in the weeks/months to come.


Leave A Comment