
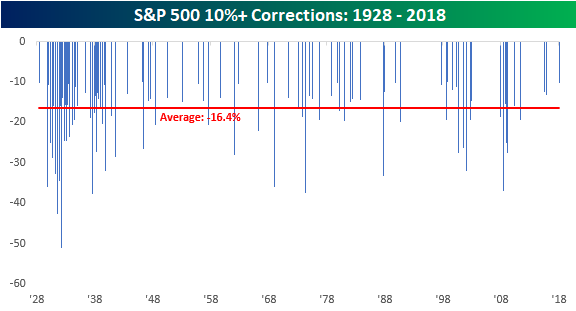
After nearly two years without one, the S&P 500 officially entered correction territory yesterday, falling 10.2% from its 1/26/18 all-time closing high. The current correction represents the 96th decline of 10%+ from a closing high that followed a gain of at least 10%. The chart below shows the magnitude of every prior correction for the S&P 500 since 1928. Not including the current period, the median decline for the S&P 500 in the 95 prior corrections was a decline of 16.4% over the course of 64 days. Keep in mind, though, that these are median levels. There have been a number of corrections (13) that saw declines of less than 11%, while several saw deeper declines of more than 20%. In terms of length, prior corrections have also been all over the map. Some have lasted as little as three days, while others have stretched on for well over a year.
Unfortunately, there is no hard and fast rule when it comes to corrections, and that’s what can make them so terrifying when you go through one. You never know when it will end. Throughout history, market corrections have ‘typically’ occurred a little more than once per year. As mentioned above, there have been 96 corrections since 1928, but if you look at their distribution over time, a good deal of them were clustered around the Great Depression. If we look just at the post-WWII period, there have been 55 corrections in the span of 73 years, reducing their frequency to once about every 16-17 months. In any event, the market was still overdue for a correction heading into the current one, but maybe not by as much as it seemed on the surface.


Leave A Comment