
The Tuesday Yellen rally that spilled into Wednesday at a decelerating rate ended today in a zombie-like session, the narrowest intraday trading range of 2016. The S&P 500 hovered around the flat line and then inched upward to its 0.19% intraday high during the lunch hour. The index then slid rather gracefully to its -0.31% intraday low shortly before the final hour of trading. A rally near the end lifted the index to the flat line, at which point some selling at the session close (which is also the month and quarter close) took the index to its modest 0.20% loss. The index logged a 1.17% gain for the week and ended March with an impressive 6.60% advance.
The yield on the 10-year note closed at 1.78%, down five basis points from the previous close.
Here is a snapshot of past five sessions in the S&P 500.
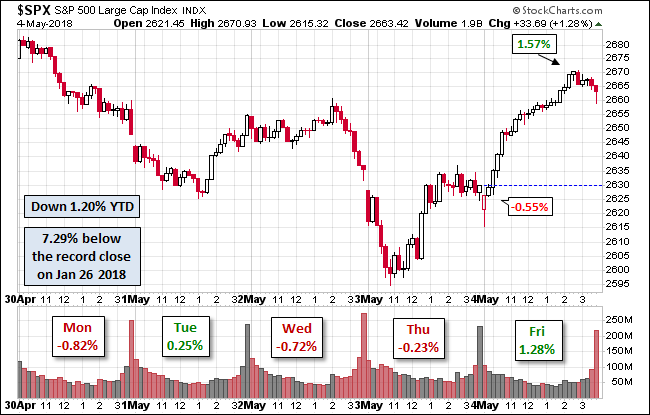
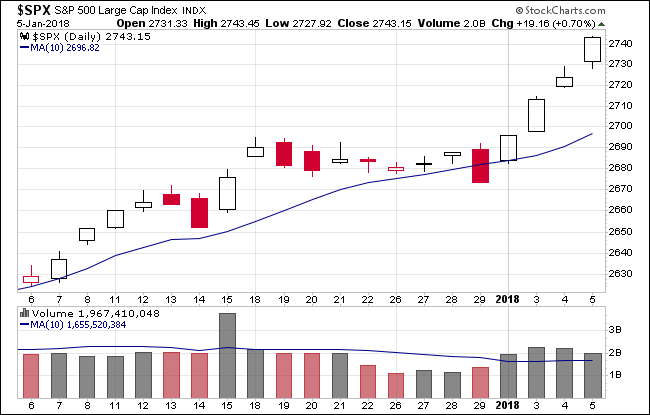
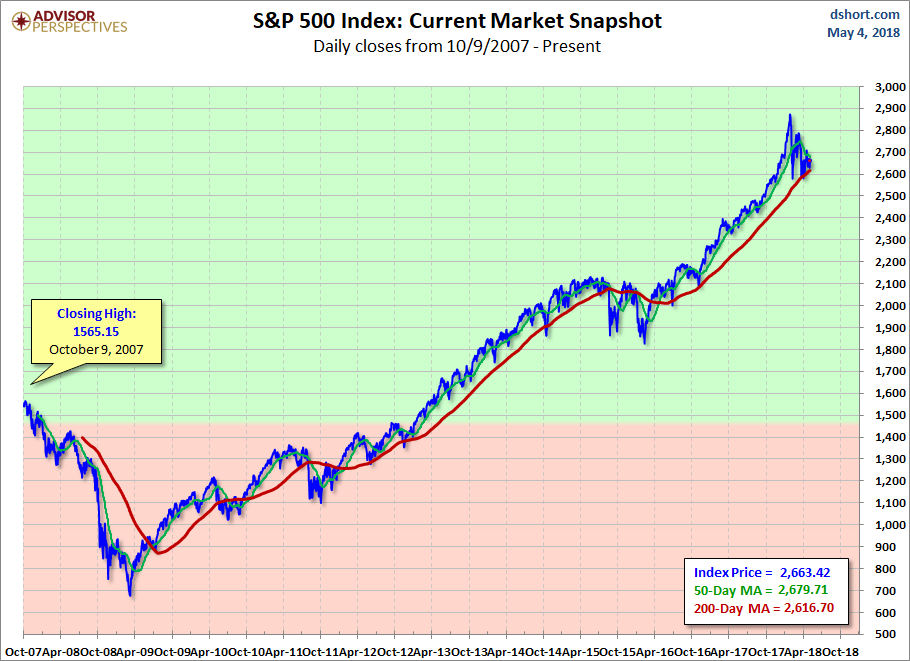
Here is a daily chart of the index. A preliminary read on today volume puts it well below its 50-day moving average, with no evidence of a typical quarter-end spike in volume.
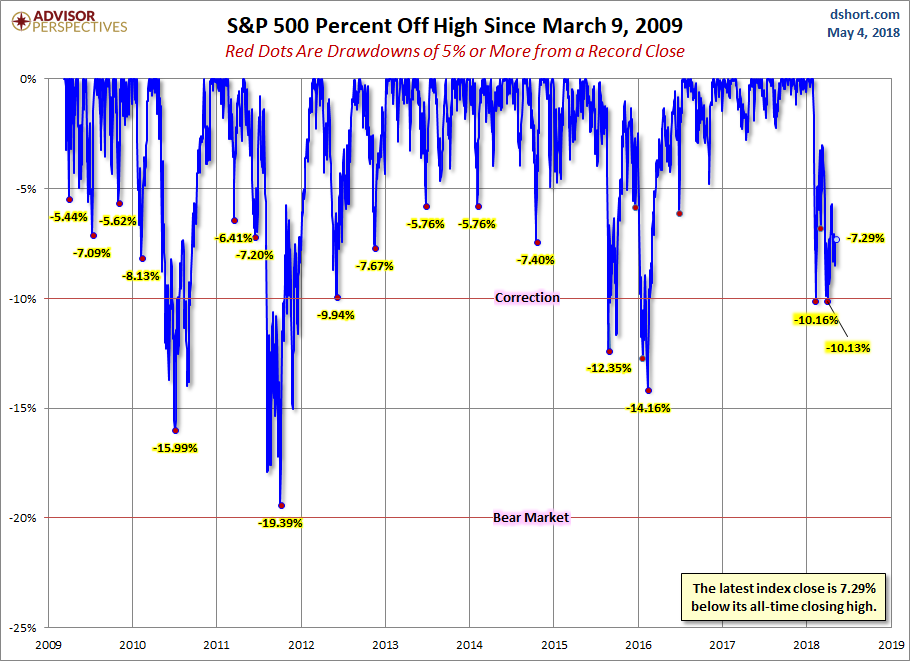
A Perspective on Drawdowns
Here’s a snapshot of selloffs since the 2009 trough.
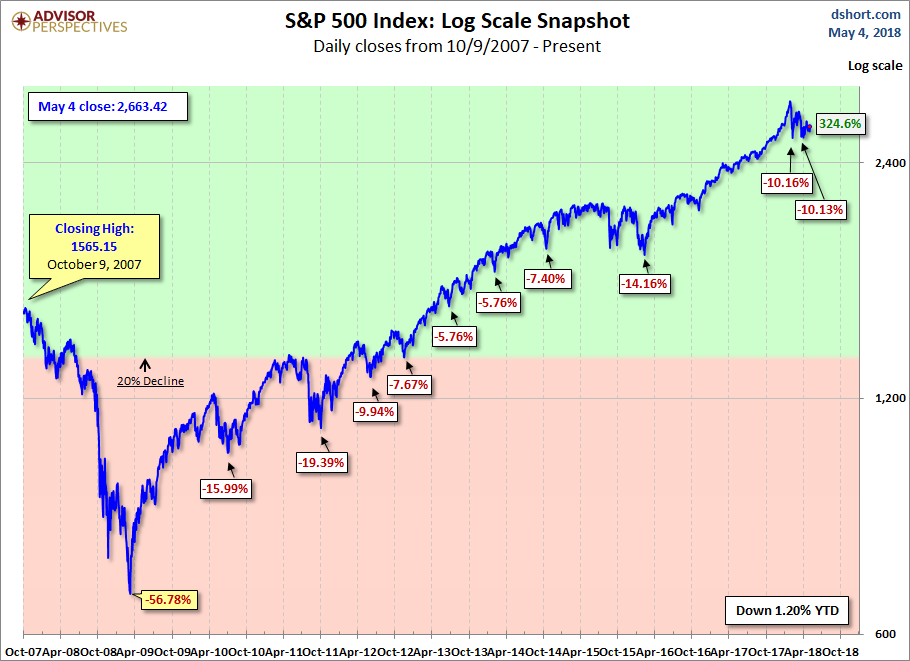
Here is a more conventional log-scale chart with drawdowns highlighted.
Here is a linear scale version of the same chart with the 50- and 200-day moving averages.
A Perspective on Volatility
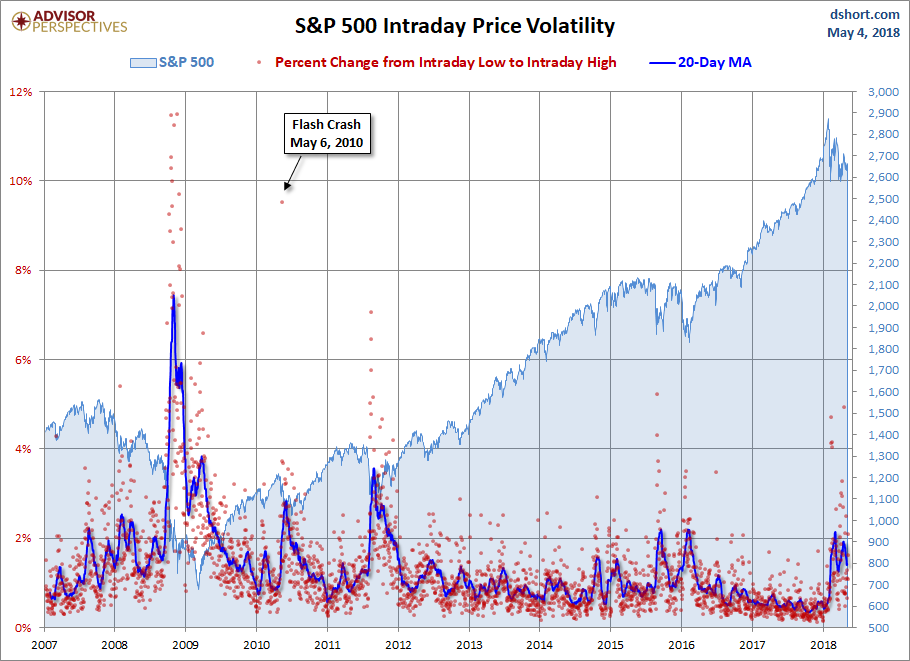
For a sense of the correlation between the closing price and intraday volatility, the chart below overlays the S&P 500 since 2007 with the intraday price range. We’ve also included a 20-day moving average to help identify trends in volatility.


Leave A Comment