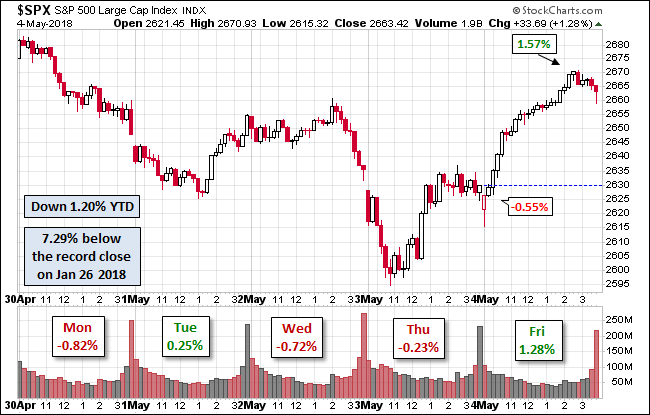
April Fools’ Day was a interesting day for the US equity market. Asian markets had a bad day with Japan’s Nikkei plunging 3.55%. The Euro STOXX 50 index fell 1.72%. With an unusually heavy day of economic updates in the US, starting with the much-followed monthly employment report, our benchmark S&P 500 dropped at the open and it its -0.77% intraday low a couple of minutes later. But the selloff was a mini-April Fools’ joke, and the index then rallied in a couple of waves to its 0.74% intraday high shortly before the close, rising above the intraday high at the mid-week Yellen rally. But some selling in the final minutes trimmed the gain to 0.63%. As we’ve illustrated on the chart below, that rally peak following Fed Chair Yellen’s Tuesday speech seems to have become a resistance level that the S&P 500 will need to address next week.
The yield on the 10-year note closed at 1.79%, up one basis point from the previous close.
Here is a snapshot of past five sessions in the S&P 500.

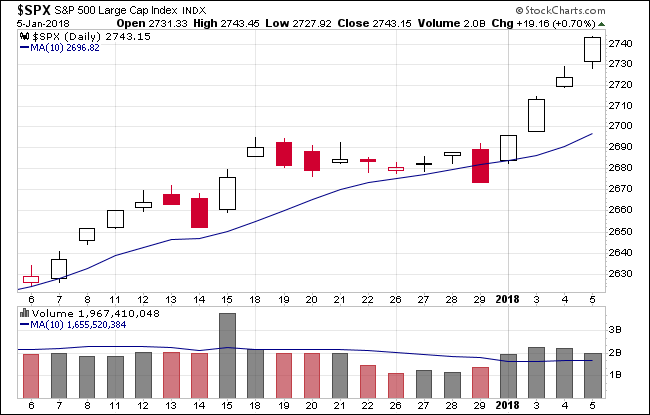
Here is a daily chart of the index. A preliminary read on today volume continues to show the index below its 50-day moving average. In fact, aside from the options expiration jump in volume, the general pattern has been a low-volume recovery from the higher volume during the selloff that started the year.
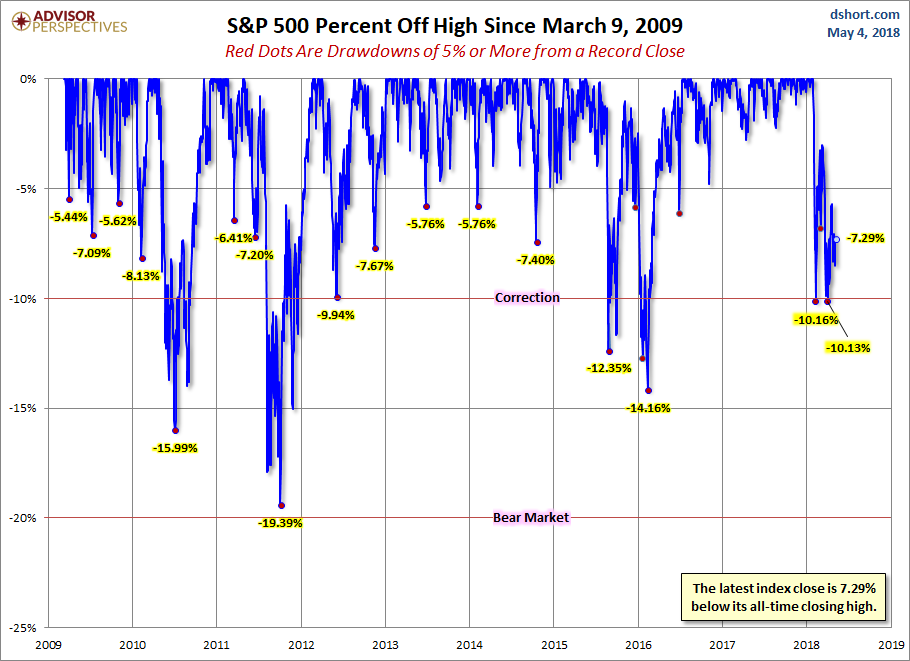
A Perspective on Drawdowns
Here’s a snapshot of selloffs since the 2009 trough.
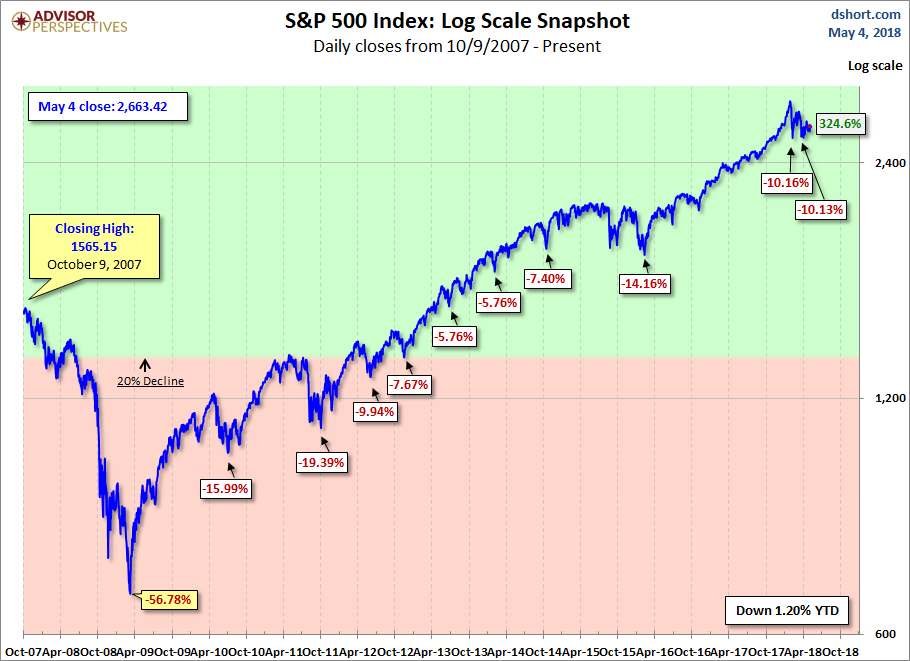
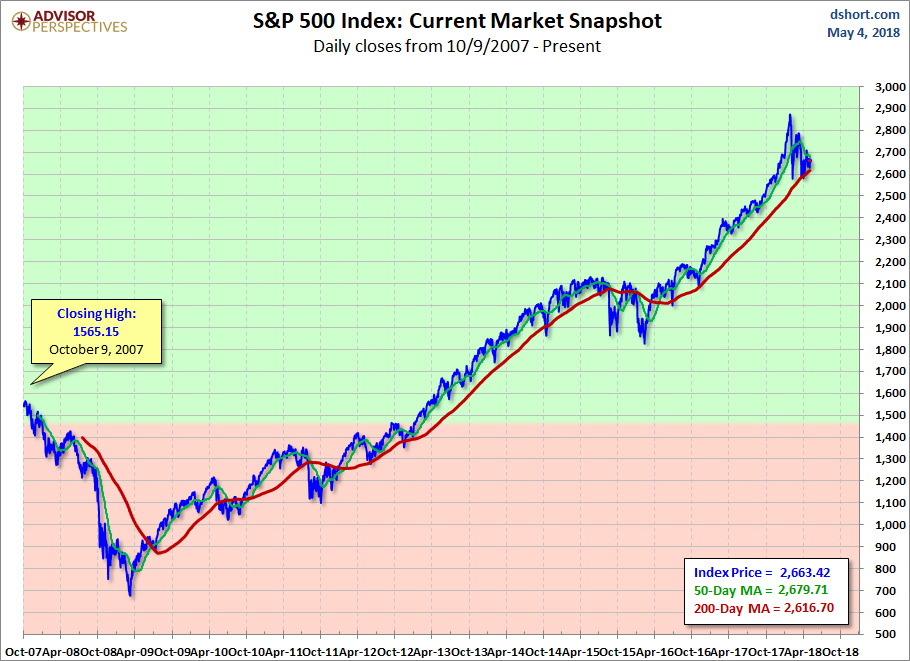
Here is a more conventional log-scale chart with drawdowns highlighted.
Here is a linear scale version of the same chart with the 50- and 200-day moving averages.
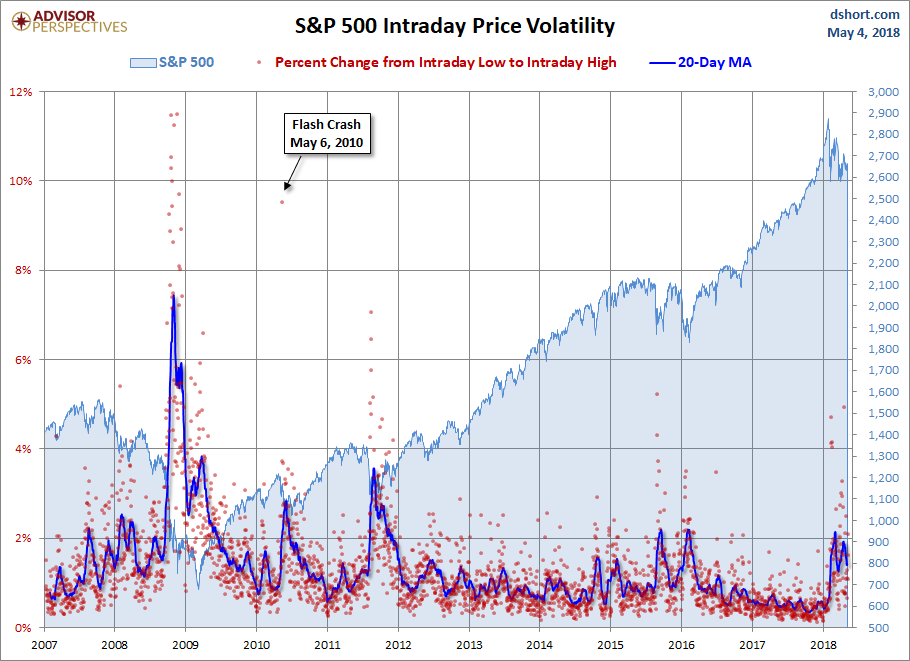
A Perspective on Volatility
For a sense of the correlation between the closing price and intraday volatility, the chart below overlays the S&P 500 since 2007 with the intraday price range. We’ve also included a 20-day moving average to help identify trends in volatility.


Leave A Comment