
Global equities were in retreat mode when the U.S. market opened. The S&P 500 followed the global pattern, falling to its -0.71% intraday low about 30 minutes later. The index then traded in a narrow range but drifted slowly higher after the lunch hour. It closed at its -0.18% intraday high. Yesterday had the distinction of being the narrowest intraday trading range of 2016 at 0.62% … until today’s even smaller 0.53%. The US equity indexes are clearly marking time in advance of Wednesday’s FOMC statement followed by Chair Yellen’s press conference.
The yield on the 10-year note closed at 1.97%, unchanged from the previous close.
Here is a snapshot of past five sessions in the S&P 500.
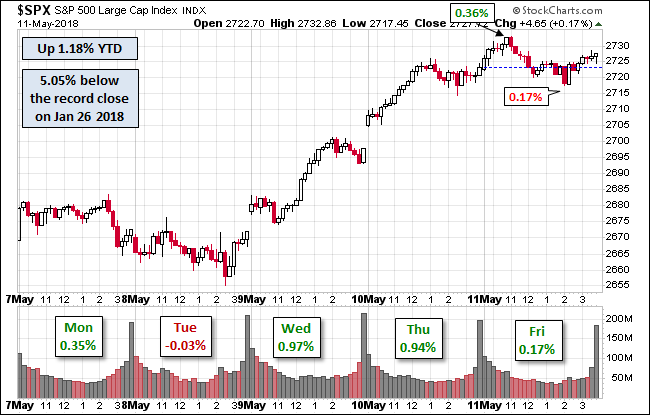
Here is a daily chart of the index. The low volume reflects the atmosphere of pre-Fed caution.

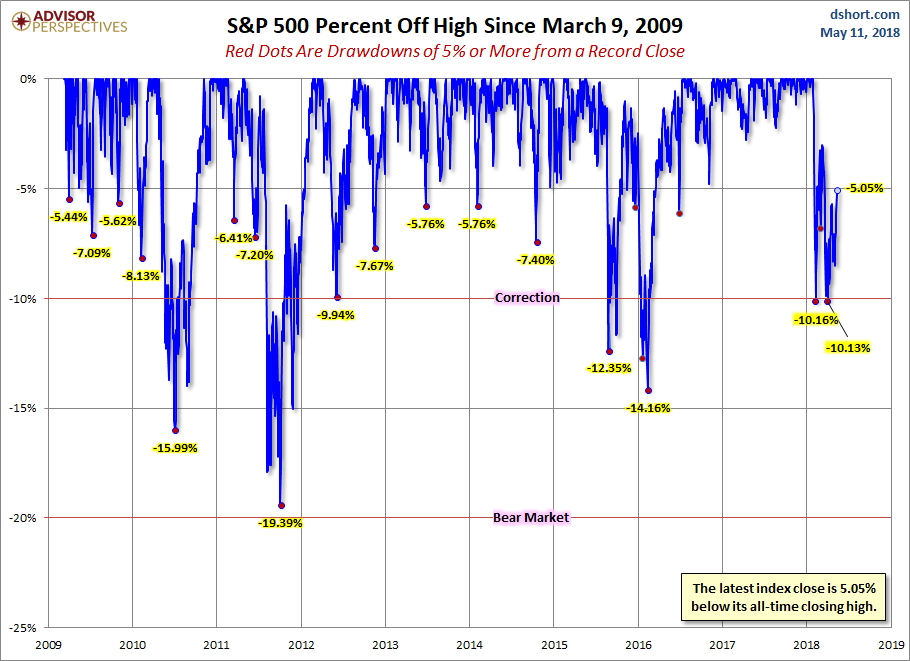
A Perspective on Drawdowns
Here’s a snapshot of selloffs since the 2009 trough.
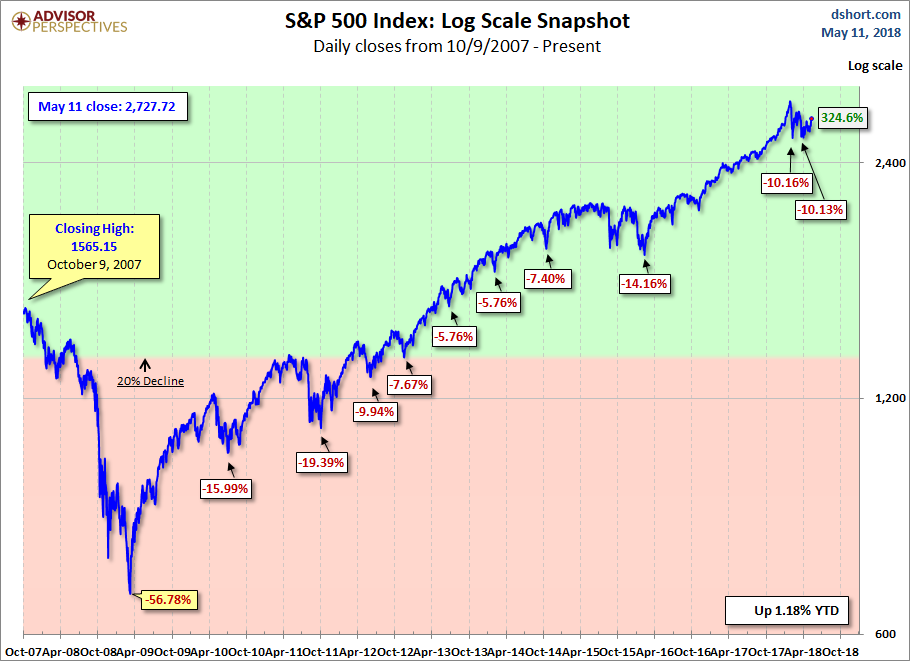
Here is a more conventional log-scale chart with drawdowns highlighted.
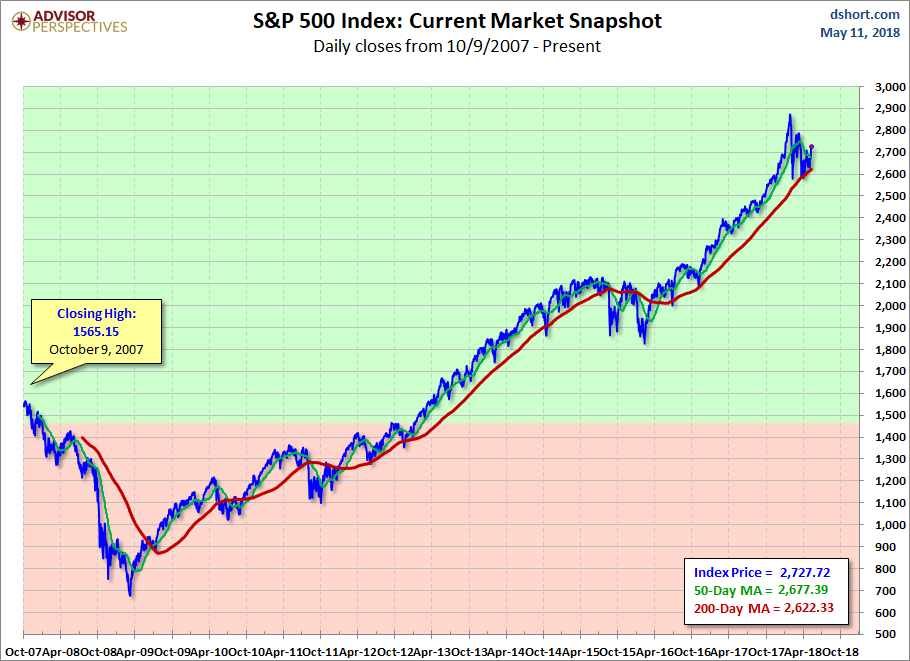
Here is a linear scale version of the same chart with the 50- and 200-day moving averages.
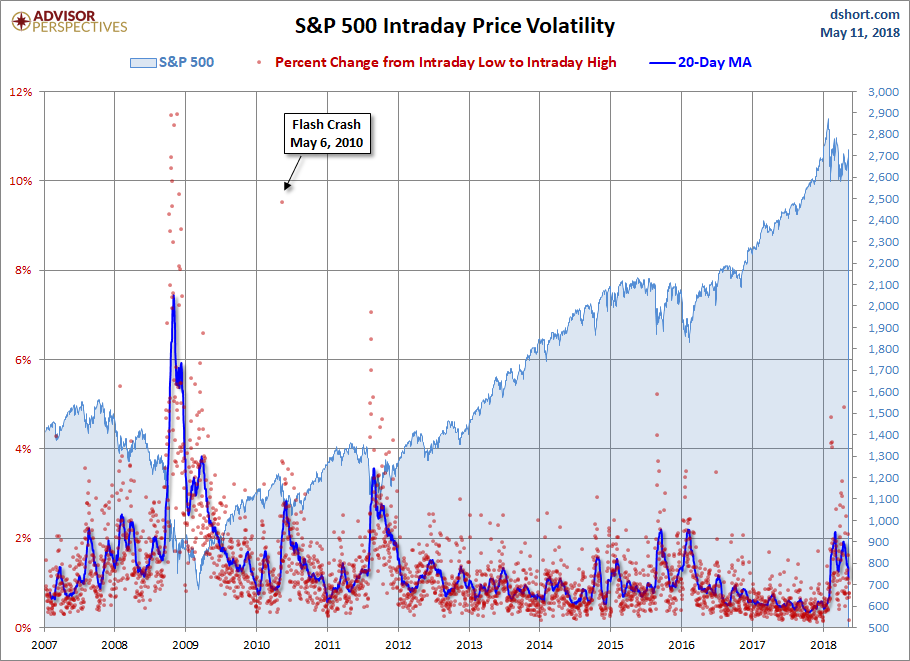
A Perspective on Volatility
For a sense of the correlation between the closing price and intraday volatility, the chart below overlays the S&P 500 since 2007 with the intraday price range. We’ve also included a 20-day moving average to help identify trends in volatility.


Leave A Comment