
Five steps forward, four steps back. That’s a close analogy for we’ve seen so far this week. The S&P 500 rose 1.25% yesterday and then dropped 0.96% today. The index dropped at the open, made a week recovery attempt during the first hour of trading and then sold off steadily throughout the day to close at its -0.96% intraday low. What changed? Weak earnings from Disney and Macy’s have perhaps caused a rethinking of consumer spending, the backbone of the economy. The retail ETF XRT plunged 4.44%. In addition, volatile oil prices are adding to the confusion. West Texas Crude was up about 5.5% today. As for consumer spending, we’ll get additional evidence on Friday with the Census Bureau’s release of April Retail Sales. Stay tuned!
As for the old “sell in May” adage, after eight sessions, the index is essentially flat for the month at -0.04%.
The yield on the 10-year note closed at 1.73%, down four basis points from the previous close.
Here is a snapshot of past five sessions in the S&P 500.
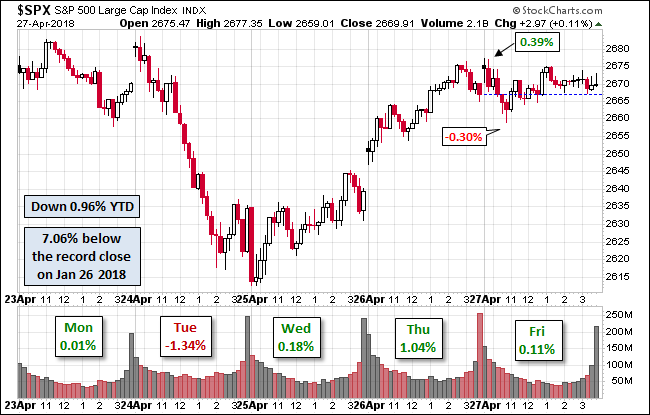
Here is a daily chart of the index. As weak the volume suggests, participation was light on today’s advance.
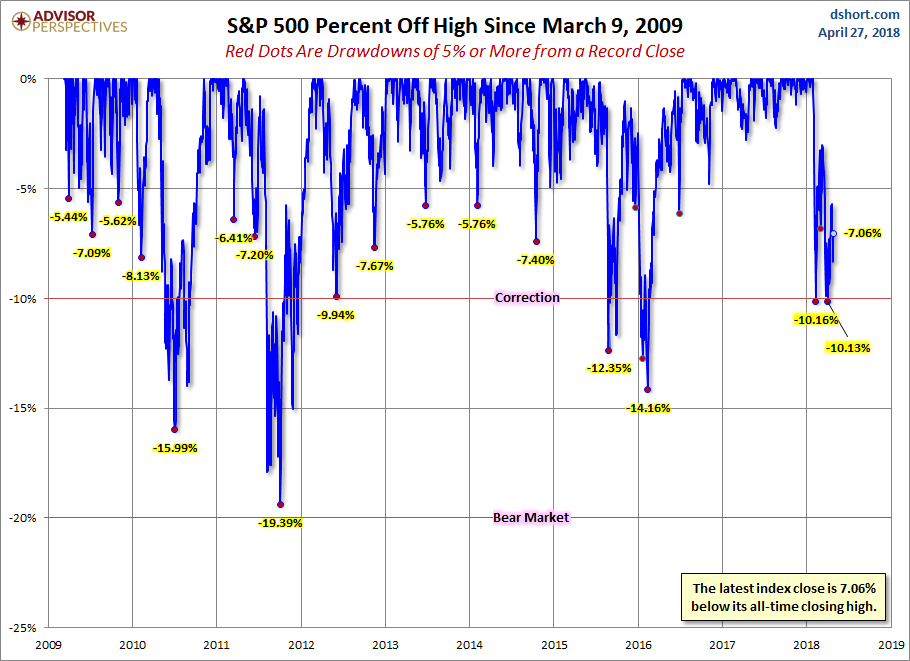
A Perspective on Drawdowns
Here’s a snapshot of selloffs since the 2009 trough.
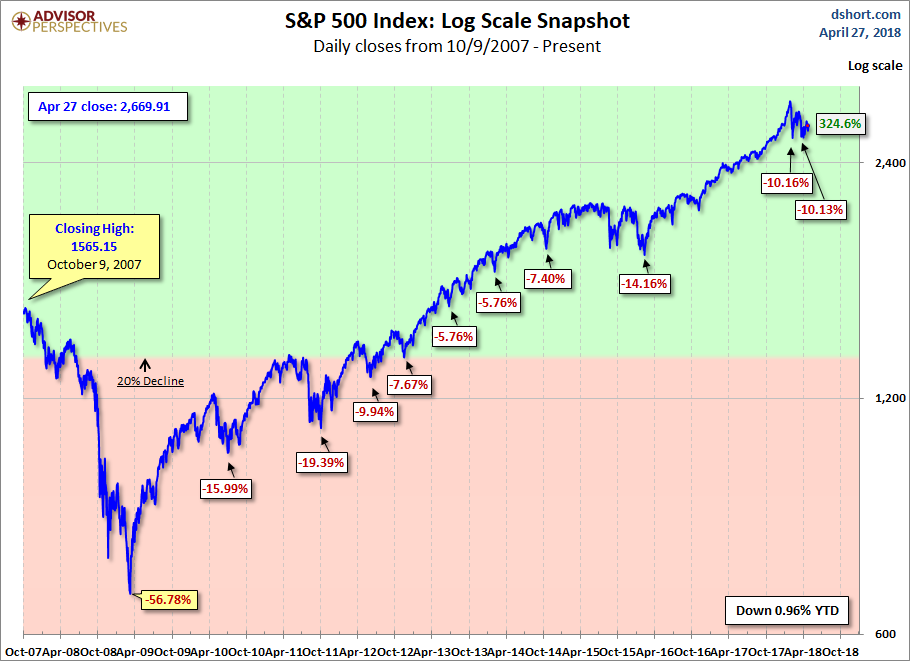
Here is a more conventional log-scale chart with drawdowns highlighted.
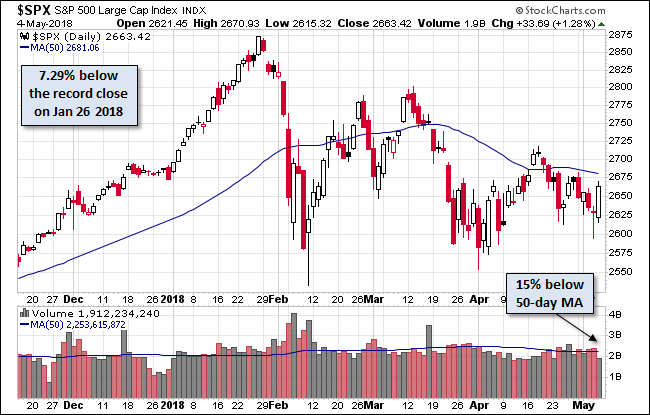
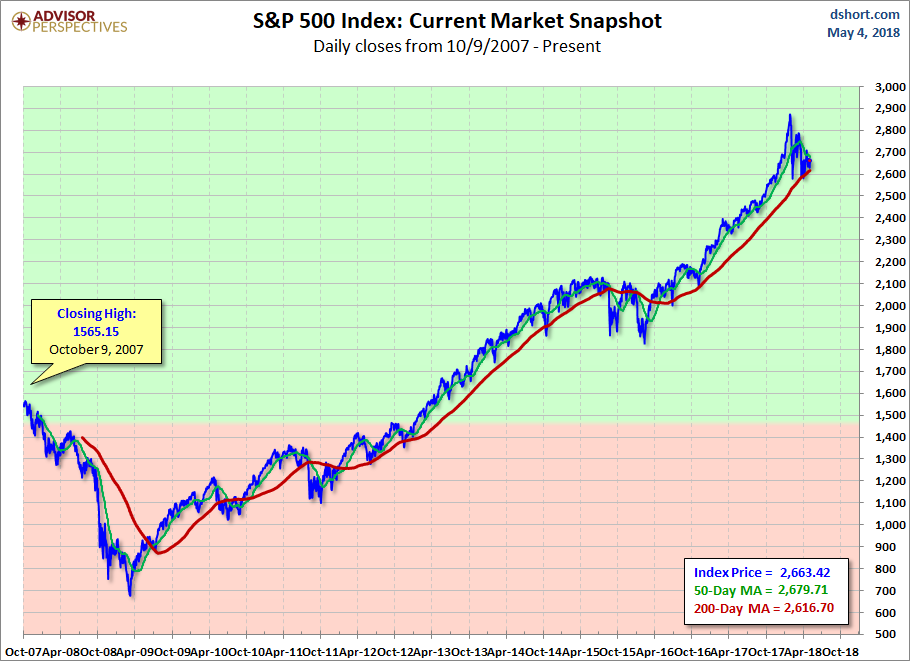
Here is a linear scale version of the same chart with the 50- and 200-day moving averages.
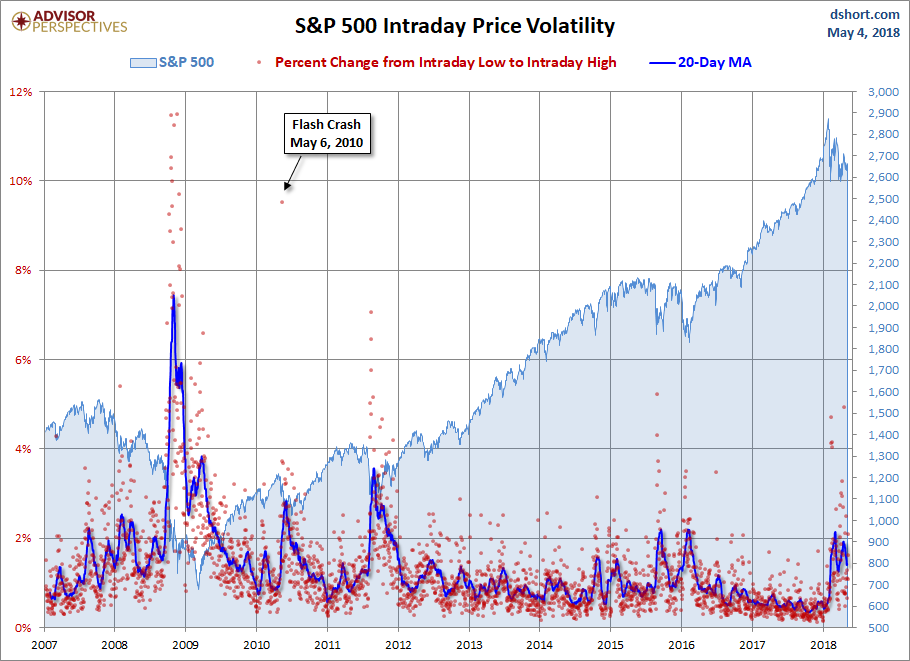
A Perspective on Volatility
For a sense of the correlation between the closing price and intraday volatility, the chart below overlays the S&P 500 since 2007 with the intraday price range. We’ve also included a 20-day moving average to help identify trends in volatility.


Leave A Comment