
US equities rallied today in a balanced move across the big three indexes. The Dow and Nasdaq rose 1.26% and our preferred benchmark, the S&P 500, posting a gain of 1.25%. The 500 surged in the opening minutes and continued to rise at a relatively steady pace through the session and finished the day just a couple of ticks off its 1.27% intraday high seconds before the close. The index is now up 1.98% year-to-date and 0.92% so far in May, the proverbial “sell and go away” month. Today’s advance was the biggest since the 1.64% pop on March 11th. Why the strong gain? Oil was up with West Texas Intermediate Crude up 3.28%, and this morning’s favorable JOLTS report probably reduced concerns over Friday’s mediocre April employment report.
The yield on the 10-year note closed at 1.77%, unchanged from the previous.
Here is a snapshot of past five sessions in the S&P 500.

Here is a daily chart of the index. As weak the volume suggests, participation was light on today’s advance.

A Perspective on Drawdowns
Here’s a snapshot of selloffs since the 2009 trough.

Here is a more conventional log-scale chart with drawdowns highlighted.

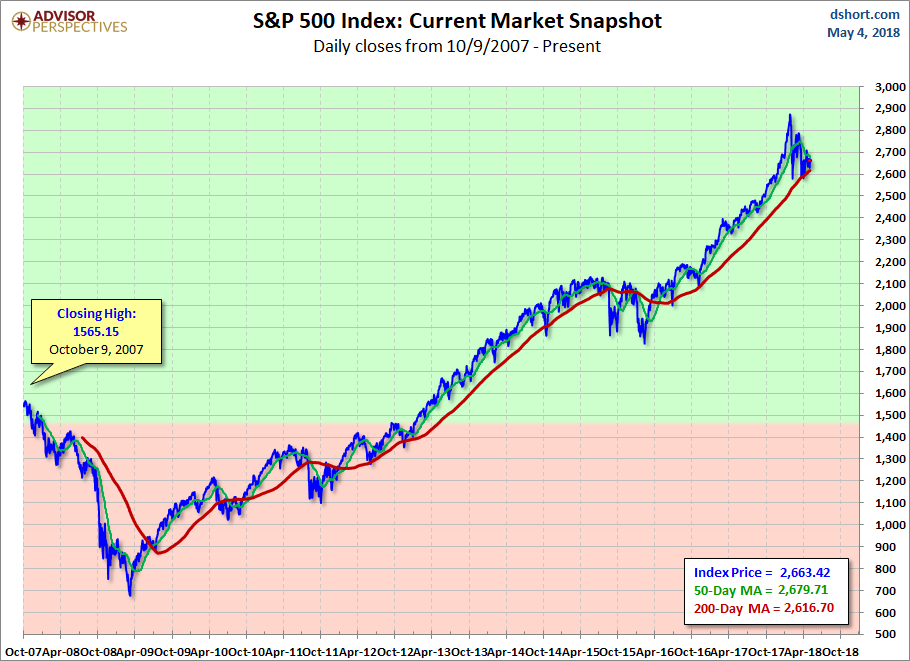
Here is a linear scale version of the same chart with the 50- and 200-day moving averages.
A Perspective on Volatility
For a sense of the correlation between the closing price and intraday volatility, the chart below overlays the S&P 500 since 2007 with the intraday price range. We’ve also included a 20-day moving average to help identify trends in volatility.


Leave A Comment