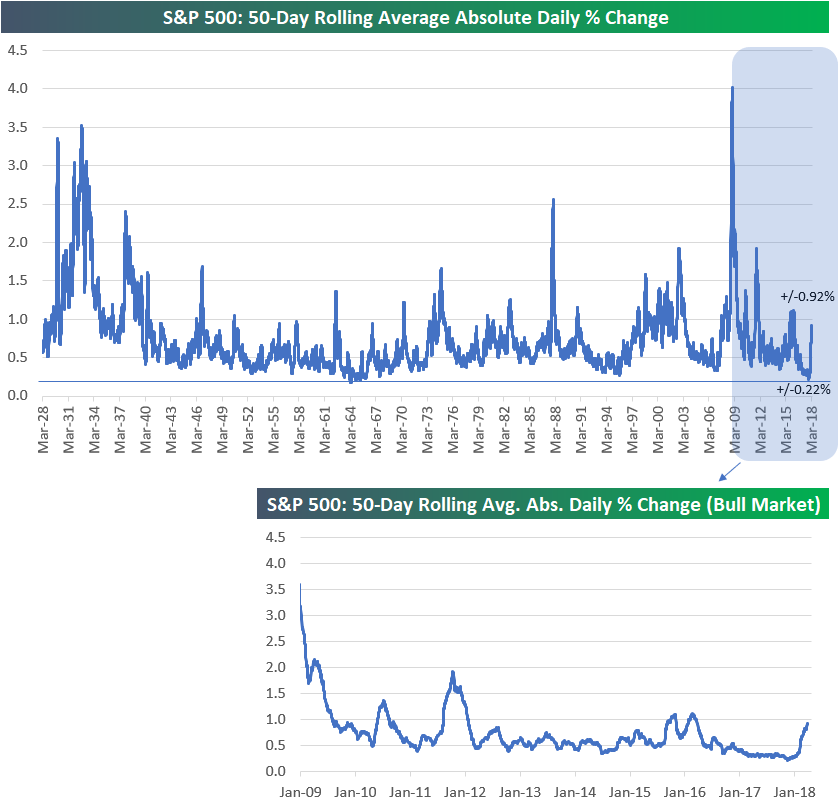
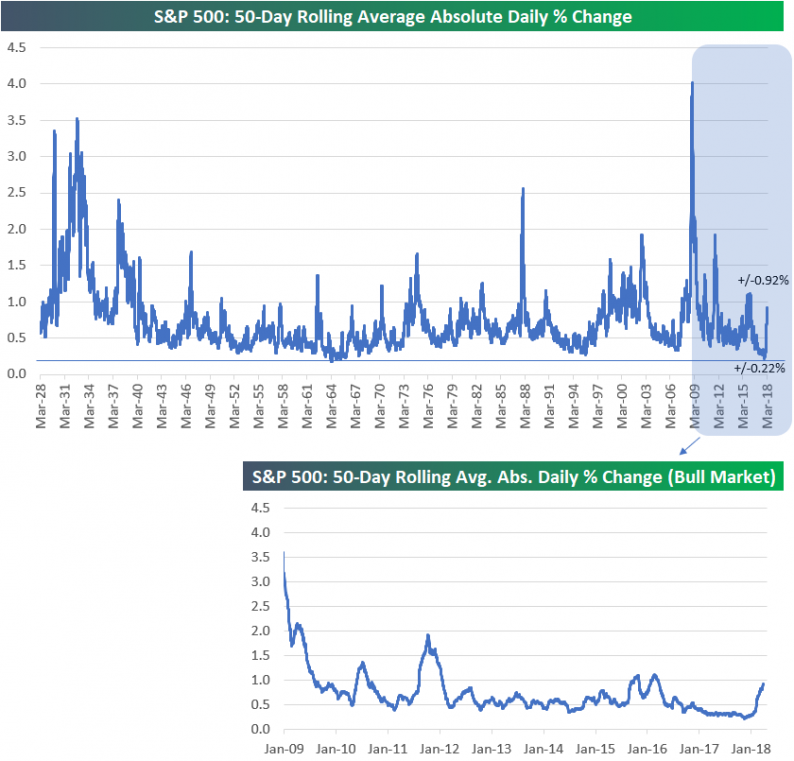
In case you haven’t noticed the pick-up in market volatility lately, the chart below does a good job of highlighting it.In the chart, we show the average absolute daily change that the S&P 500 has experienced over the last 50 trading days. As shown, after hitting a multi-decade low of just +/-0.22% in mid-November 2017, the S&P’s average daily change is now ticking up towards 1%. As of today, the S&P has averaged a move of +/-0.92% over the last 50 trading days.
Prior to the S&P’s peak on January 26th, the index hadn’t experienced a 1% move in either direction over the prior 60 trading days. In the 41 trading days since the peak, nearly half (18) have been 1%+ moves!
If you feel like the recent uptick in volatility is too much to take, one look at the chart shows you that really we haven’t seen anything yet. During the current bull market, there have been three periods where the reading moved well above +/-1%, and at the height of the Financial Crisis at one point, the S&P was averaging a daily change of more than 4%!


Leave A Comment