
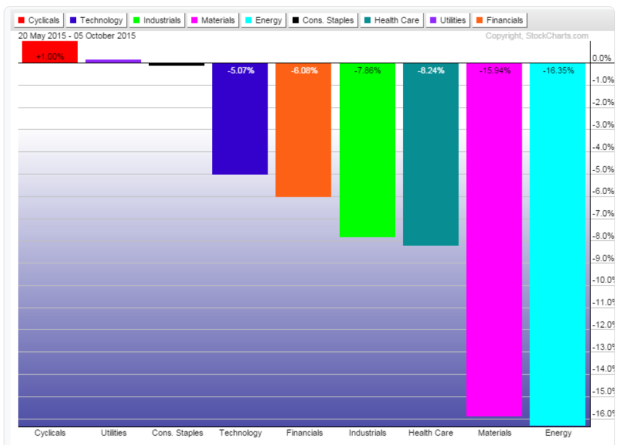
The chart above depicts the individual sector performance since the May highs in the markets. This gives a good idea about relative strength and weakness. The weakness is obviously coming in the Energy, Healthcare, and Materials sectors. Let’s take a look at their performance during the rally off last week’s lows.
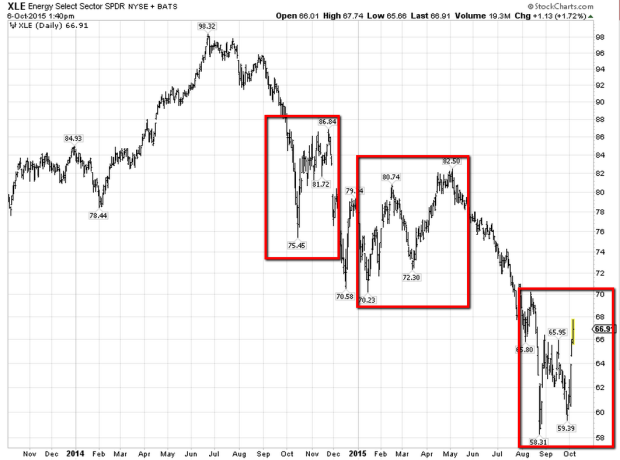
The energy sector (XLE) has had two prior retrace rallies in the downtrend. Each rally has pushed price up about $12 before failing and making another new low. This projects potential resistance around $70.
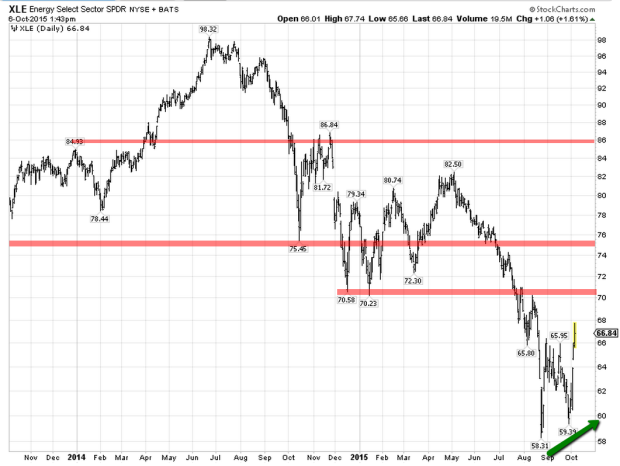
A closer look revealed some underlying strength with this most recent higher low and higher high setup. Resistance is at $70, $75.50 and $85. A move above $70 would break this most recent downtrend and put the odds in favor of reaching $85 again.
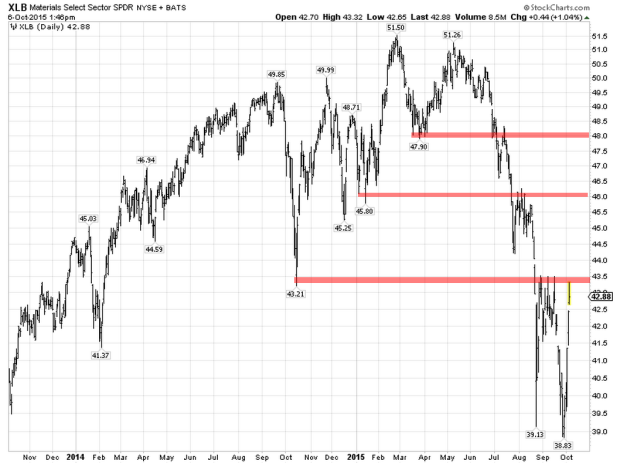
The Materials sector (XLB) is at resistance right now around $43.50. It’s still within it’s downtrend but could be ready for a sharper snap back rally if it can break above $43.50. $46 and $48would be the next likely resistance points.
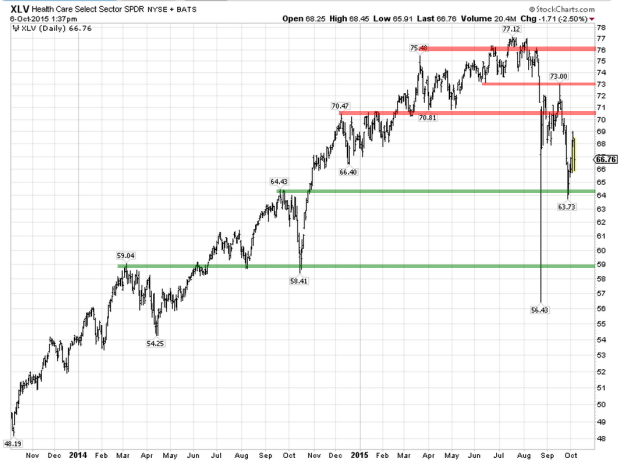
Lastly we look at the Healthcare sector (XLV). It’s a little concerning to see one of the sectors that have led this bull market, suddenly roll over. As you can clearly see, it was one of the sectors that was hardest hit during the August 24th flash crash, and it really hasn’t recovered since.
It’s important to point out that the Health Care sector led Q2 revenue and earnings growth and is projected to be in the top 3 sectors for Q3 revenue and earnings growth also. So this sell off could be overdone and/or investors have suddenly changed their minds about paying 20x earnings (according to Morningstar) for the sector.
I see support at $64.50 and resistance at 70.50. This likely comes down to what direction the macro market takes in the coming months. A break below $64.50 and it’s likely to retest $59. A break above $70.50 and you have a good shot of eventually making new bull market highs again.


Leave A Comment